ChesapeakeRSC
The ChesapeakeRSC1 model is an open source segmentation model that can detect roads from high resolution imagery, even when those roads may be occluded by tree cover. This model predicts 2 classes:- background
- road
Preview: model inputs and outputs
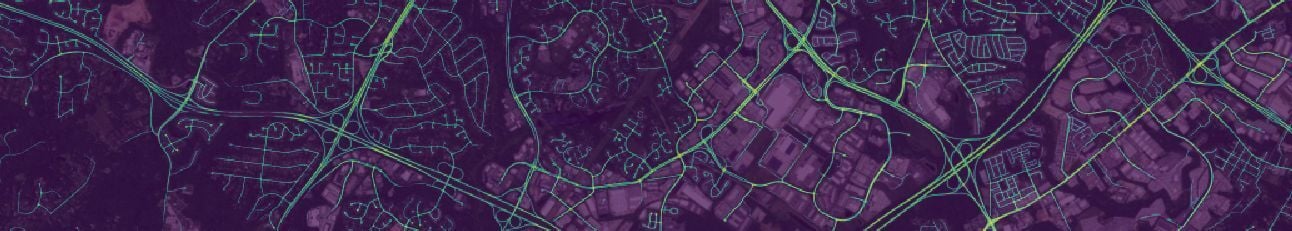
The interactive map linked below shows the input imagery and model outputs for this notebook’s example AOI. Toggle layers in the sidebar to compare the inputs, the raster model output, and the vectorized geometries side-by-side. Layers:- ChesapeakeRSC input mosaic: RGB high-resolution aerial imagery the model runs on
- ChesapeakeRSC model outputs: single-band raster output from the model (road class)
- ChesapeakeRSC vector geometries: vectorized road polygons derived from the raster output
- ChesapeakeRSC PM Tiles: same vectors delivered as PMTiles for fast rendering at scale
Selecting an Area of Interest (AOI)
We will choose an Area of Interest (AOI) for our analysis. ChesapeakeRSC was trained on select geographies in the Northeastern United States. We will try it out in Montgomery County, Maryland.Initializing the RasterFlow client
Running a model
RasterFlow has pre-defined workflows to simplify orchestration of the processing steps for model inference. These steps include:- Ingesting imagery for the specified Area of Interest (AOI)
- Generating a seamless image from multiple image tiles (a mosaic)
- Running inference with the selected model
(Optional) Build an optimized Zarr for visualization
RasterFlow writes its outputs as Zarr stores at native resolution. To explore them interactively on cloud.wherobots.com/map, you can build an optimized multiscale Zarr.build_zarr_multiscales adds downsampled overview levels (image pyramids) to the store so the map can stream coarse tiles when zoomed out and full-resolution pixels when zoomed in.
This step is optional and can take a few minutes for large outputs, so the code below is commented out by default — uncomment it to run it.
Visualizing outputs
If RasterFlow is enabled for your organization, you can visualize the Zarr, GeoParquet, and other geospatial outputs using cloud.wherobots.com/map.Vectorize the raster model outputs
The output for the ChesapeakeRSC model is a raster with two classes: background and road. We can run a seperate flow to convert the roads into vector geometries, based on the confidence threshold. Converting these results to geometries allows us to more easily post process the results or join the resuilts with other vector data.Save the vectorized results to the catalog
We can store these vectorized outputs in the catalog by using WherobotsDB to persist the GeoParquet results.Visualize the vectorized results
To visualize the vectorized results, we will choose a small subset of the outputs that intersect with a bounding box around the center of the AOI. We will also filter out results with a score lower than 0.7.Generate PM Tiles for visualization
To improve visualization performance of a large number of geometries, we can use Wherobots built-in high performance PM tile generator.References
- Robinson, C., Corley, I., Ortiz, A., Dodhia, R., Lavista Ferres, J. M., & Najafirad, P. (2024). Seeing the roads through the trees: A benchmark for modeling spatial dependencies with aerial imagery. arXiv preprint arXiv:2401.06762. https://arxiv.org/abs/2401.06762