SAM3
SAM3 is a text-prompted geometry inference model that detects objects in imagery based on natural language descriptions. Given a text prompt like"building" or "roofs", the model produces georeferenced vector geometries (bounding boxes or polygons) for each detected object, along with a confidence score.
Unlike segmentation models that produce raster outputs, SAM3 directly outputs vector geometries, making it straightforward to integrate results into geospatial workflows. We will demonstrate results using 30cm resolution data from the National Agriculture Imagery Program (NAIP).
Preview: model inputs and outputs
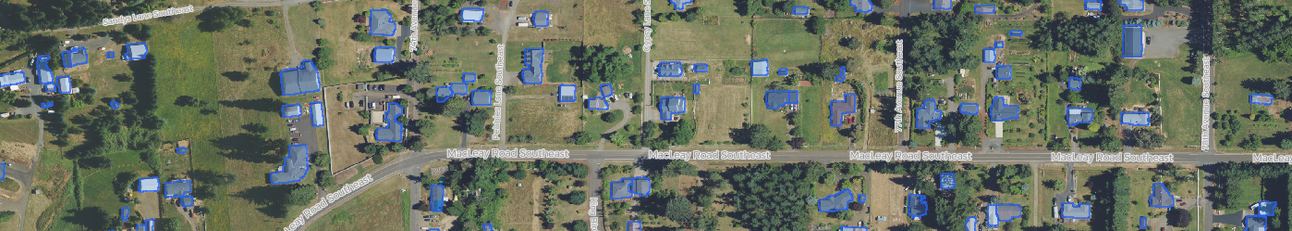
The interactive map linked below shows the input imagery and model output for this notebook’s example AOI. Toggle layers in the sidebar to compare the input imagery with the model’s PMTiles output side-by-side. Layers:- SAM3 input mosaic: RGB NAIP aerial imagery the model runs on
- SAM3 PM Tiles: polygons output directly by the text-prompted model, delivered as PMTiles for fast rendering at scale (SAM3 is a geometry inference model, so there is no intermediate raster output)
Selecting an Area of Interest (AOI)
To start, we will choose an Area of Interest (AOI) for our analysis where 30cm resolution NAIP data is available: College Park, Maryland. The National Agriculture Imagery Program (NAIP) provides aerial imagery for the United States, capturing high-resolution images during the agricultural growing seasons. To try other AOIs, be sure to choose a region where 30cm resolution imagery is available. See this map for more details.Initializing the RasterFlow client
Running geometry inference
RasterFlow has pre-defined recipes that simplify orchestration of the processing steps for geometry inference. These steps include:- Ingesting imagery for the specified Area of Interest (AOI)
- Generating a seamless mosaic from multiple image tiles
- Running text-prompted geometry inference with the SAM3 model
Note: TheNote: This step will take approximately 22 minutes to complete the first time it is run.patch_sizeconfigured byInferenceConfigis always resized to 1008x1008 by theGeometryModelRecipes.SAM3_TEXT_GEOMETRYandGeometryModelRecipes.SAM3_TEXT_BBOXrecipes. This means you can control the amount of spatial context passed to SAM3 in each pass, but selecting patch sizes larger than 1008x1008 will upsample the resolution.
Explore the detected geometries
The geometry inference output is a GeoDataFrame where each row is a detected object. The columns include:geometry: the georeferenced polygon for the detectionlabel: the text prompt category (e.g."roofs")bbox_score: confidence score for the detectionbbox: bounding box coordinatestime: timestamp of the source imagery