Tile2Net
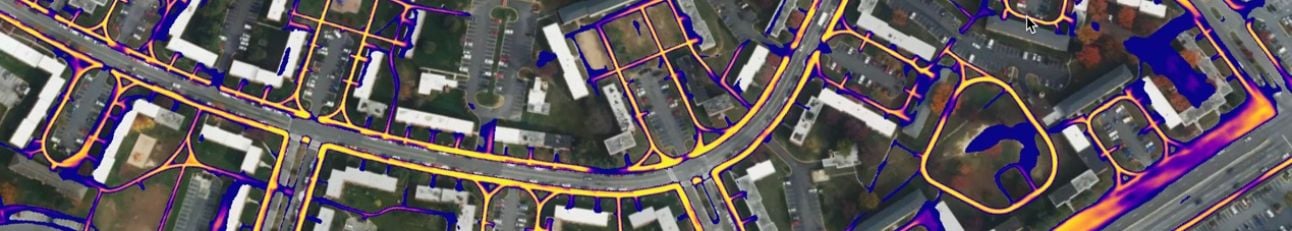
The Tile2Net1 model is an open source segmentation model that can detect sidewalks and other pathways from very high resolution imagery. This model predicts 4 classes:- background
- road
- sidewalk
- crosswalk
Preview: model inputs and outputs
The interactive map linked below shows the input imagery and model outputs for this notebook’s example AOI. Toggle layers in the sidebar to compare the inputs, the raster model output, and the vectorized geometries side-by-side. Layers:- Tile2Net input mosaic: RGB high-resolution aerial imagery the model runs on
- Tile2Net model outputs: raster output from the model, with bands for sidewalk / road / crosswalk classes
- Tile2Net vector geometries: vectorized sidewalk / road / crosswalk polygons derived from the raster output
- Tile2Net PM Tiles: same vectors delivered as PMTiles for fast rendering at scale
Selecting an Area of Interest (AOI)
To start, we will choose an Area of Interest (AOI) for our analysis. Tile2Net was trained on select geographies in the Northeastern United States. So we will pick a location in that geographic region that wasn’t in the training data and where these is recent 30cm resolution NAIP data: College Park, Maryland. The National Agriculture Imagery Program (NAIP) provides aerial imagery for the United States, capturing high-resolution images during the agricultural growing seasons. The 2023 NAIP dataset offers 30cm resolution imagery in certain regions, see this map for more details.Initializing the RasterFlow client
Running a model
RasterFlow has pre-defined workflows to simplify orchestration of the processing steps for model inference. These steps include:- Ingesting imagery for the specified Area of Interest (AOI)
- Generating a seamless image from multiple image tiles (a mosaic)
- Running inference with the selected model
(Optional) Build an optimized Zarr for visualization
RasterFlow writes its outputs as Zarr stores at native resolution. To explore them interactively on cloud.wherobots.com/map, you can build an optimized multiscale Zarr.build_zarr_multiscales adds downsampled overview levels (image pyramids) to the store so the map can stream coarse tiles when zoomed out and full-resolution pixels when zoomed in.
This step is optional and can take a few minutes for large outputs, so the code below is commented out by default — uncomment it to run it.
Visualizing outputs
If RasterFlow is enabled for your organization, you can visualize the Zarr, GeoParquet, and other geospatial outputs using cloud.wherobots.com/map.Vectorize the raster model outputs
The output for the Tile2Net model is a raster with four classes: background, road, sidewalk, crosswalk. We can run a seperate flow to convert the roads, sidewalks and crosswalks into vector geometries, based on the confidence threshold. Converting these results to geometries allows us to more easily post process the results or join the resuilts with other vector data.Save the vectorized results to the catalog
We can store these vectorized outputs in the catalog by using WherobotsDB to persist the GeoParquet results.Visualize the vectorized results
To visualize the vectorized results, we will filter out results with a score lower than 0.2. This threshold was determined through observation to strike a balance: it eliminates obvious noise without being overly aggressive, ensuring that we don’t accidentally filter out too many relevant results. Gaps in prediction for Tile2net are likely due to it being used with lower resolution imagery (30cm resolution) than what it was trained on (19cm resolution), as well as changes in geographic context, and occlusion from trees over the pathways.Generate PM Tiles for visualization
To improve visualization performance of a large number of geometries, we can use Wherobots built-in high performance PM tile generator.References
- Hosseini, M., Sevtsuk, A., Miranda, F., Cesar Jr, R. M., & Silva, C. T. (2023). Mapping the walk: A scalable computer vision approach for generating sidewalk network datasets from aerial imagery. Computers, Environment and Urban Systems, 101, 101950.