SedonaPyDeck and SedonaKepler wrappers already installed, so you can create interactive maps from SedonaDataFrames right in your Jupyter environment.
Both
SedonaPyDeck and SedonaKepler expect the default geometry order to be longitude-latitude. If your dataframe has geometries in the latitude-longitude order, consider using ST_FlipCoordinates to rearrange your coordinates.Both
SedonaPyDeck and SedonaKepler are designed to work with SedonaDataFrames containing only 1 geometry column. Passing dataframes with multiple geometry columns will cause errors.SedonaPyDeck
Spatial query results can be visualized in a Jupyter lab/notebook environment usingSedonaPydeck.
SedonaPyDeck exposes APIs to create interactive map visualizations using pydeck based on deck.gl
The following tutorial showcases the various maps that can be created using SedonaPyDeck, the datasets used to create these maps are publicly available.
Each API exposed by SedonaPyDeck offers customization via optional arguments, details on all possible arguments can be found in the API docs of SedonaPyDeck.
Creating a Choropleth map using SedonaPyDeck
SedonaPyDeck exposes a create_choropleth_map API which can be used to visualize a choropleth map out of the passed SedonaDataFrame containing polygons with an observation:
Example (referenced from example notebook available via binder):
plot_col is a required argument informing SedonaPyDeck of the column name used to render the choropleth effect.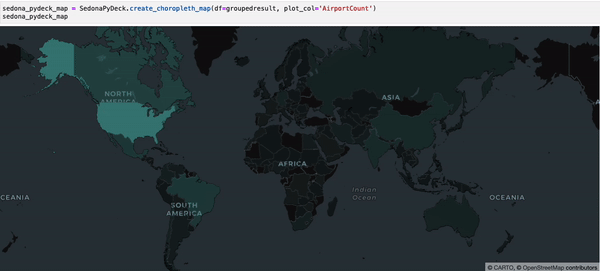
Creating a Geometry map using SedonaPyDeck
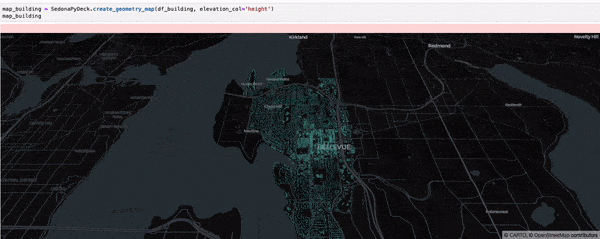
SedonaPyDeck exposes a create_geometry_map API which can be used to visualize a passed SedonaDataFrame containing any type of geometries:
Example (referenced from overture notebook available via binder):
Creating a scatter plot using SedonaPyDeck
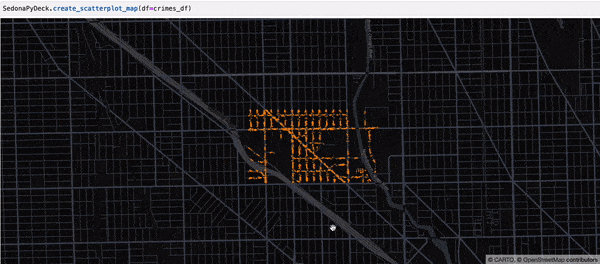
SedonaPyDeck exposes a create_scatterplot_map API which can be used to visualize a scatter plot out of the passed SedonaDataFrame containing points:
Example:
Creating a heatmap using SedonaPyDeck
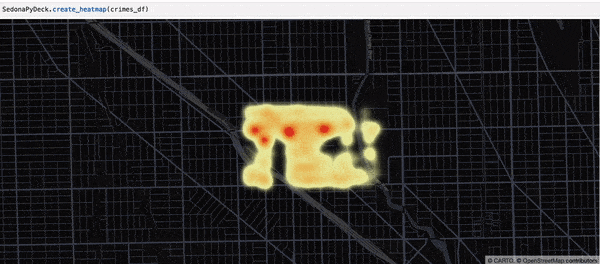
SedonaPyDeck exposes a create_heatmap API which can be used to visualize a heatmap out of the passed SedonaDataFrame containing points:
Example:
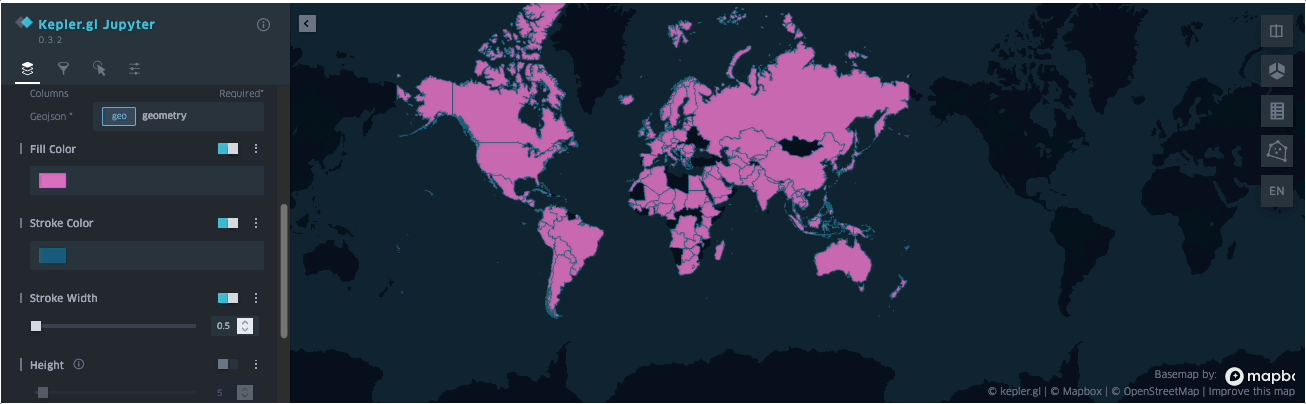
SedonaKepler
Spatial query results can be visualized in a Jupyter lab/notebook environment usingSedonaKepler.
SedonaKepler exposes APIs to create interactive and customizable map visualizations using KeplerGl.
This tutorial showcases how simple it is to instantly visualize geospatial data using SedonaKepler.
Example (referenced from an example notebook via the binder):
SedonaKepler are listed in the SedonaKepler API docs