imageWidth. Optionally, an imageWidth parameter can be passed to RS_AsImage in order to increase the size of the rendered image (default: 200).
This function only works for rasters with byte data, and bands ≤ 4 (Grayscale - RGBA). You can check the data type of an existing raster by using RS_BandPixelType or create your own raster by passing
'B' while using RS_MakeEmptyRaster.Signatures
Parameters
The input raster.
The image width value.
Return type
A string representation.
Examples
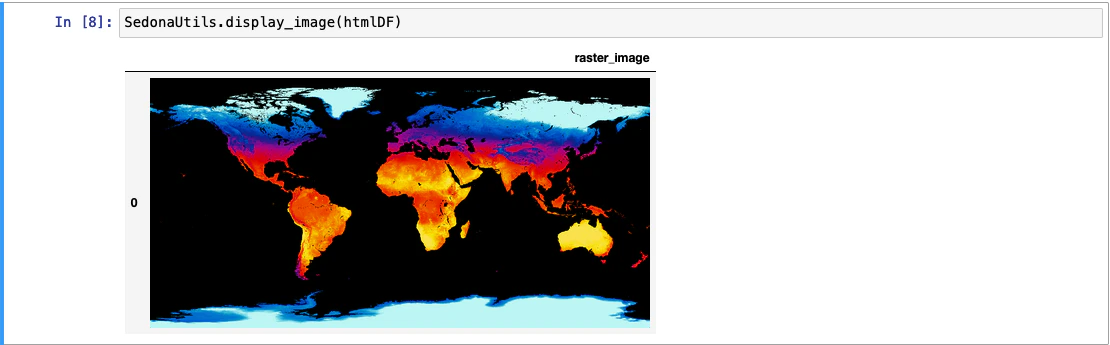
Display raster in Jupyter
SedonaUtils.display_image(df) is a Python wrapper that renders raster images directly in a Jupyter notebook. It automatically detects raster columns in the DataFrame and applies RS_AsImage under the hood, so you don’t need to call RS_AsImage yourself. You can also pass a DataFrame with pre-applied RS_AsImage HTML.
— direct raster display (recommended)
— with explicit RS_AsImage