> ## Documentation Index
> Fetch the complete documentation index at: https://docs.wherobots.com/llms.txt
> Use this file to discover all available pages before exploring further.
# Visualize Geometry Results
WherobotsDB comes with `SedonaPyDeck` and `SedonaKepler` wrappers already installed, so you can create interactive maps from SedonaDataFrames right in your Jupyter environment.
Both `SedonaPyDeck` and `SedonaKepler` expect the default geometry order to be longitude-latitude. If your dataframe has geometries in the latitude-longitude order, consider using [`ST_FlipCoordinates`](https://sedona.apache.org/latest-snapshot/api/sql/Function/#st_flipcoordinates) to rearrange your coordinates.
Both `SedonaPyDeck` and `SedonaKepler` are designed to work with SedonaDataFrames containing only 1 geometry column. Passing dataframes with multiple geometry columns will cause errors.
### SedonaPyDeck
Spatial query results can be visualized in a Jupyter lab/notebook environment using `SedonaPydeck`.
`SedonaPyDeck` exposes APIs to create interactive map visualizations using [`pydeck`](https://pydeck.gl/index.html#) based on [`deck.gl`](https://deck.gl/)
The following tutorial showcases the various maps that can be created using `SedonaPyDeck`, the datasets used to create these maps are publicly available.
Each API exposed by `SedonaPyDeck` offers customization via optional arguments, details on all possible arguments can be found in the [API docs of `SedonaPyDeck`](/reference/wherobots-db/geometry-data/visualization/visualization_sedona-pydeck).
### Creating a Choropleth map using SedonaPyDeck
`SedonaPyDeck` exposes a `create_choropleth_map` API which can be used to visualize a choropleth map out of the passed SedonaDataFrame containing polygons with an observation:
Example (referenced from example notebook available via binder):
```python theme={"system"}
SedonaPyDeck.create_choropleth_map(df=groupedresult, plot_col='AirportCount')
```
`plot_col` is a required argument informing `SedonaPyDeck` of the column name used to render the choropleth effect.
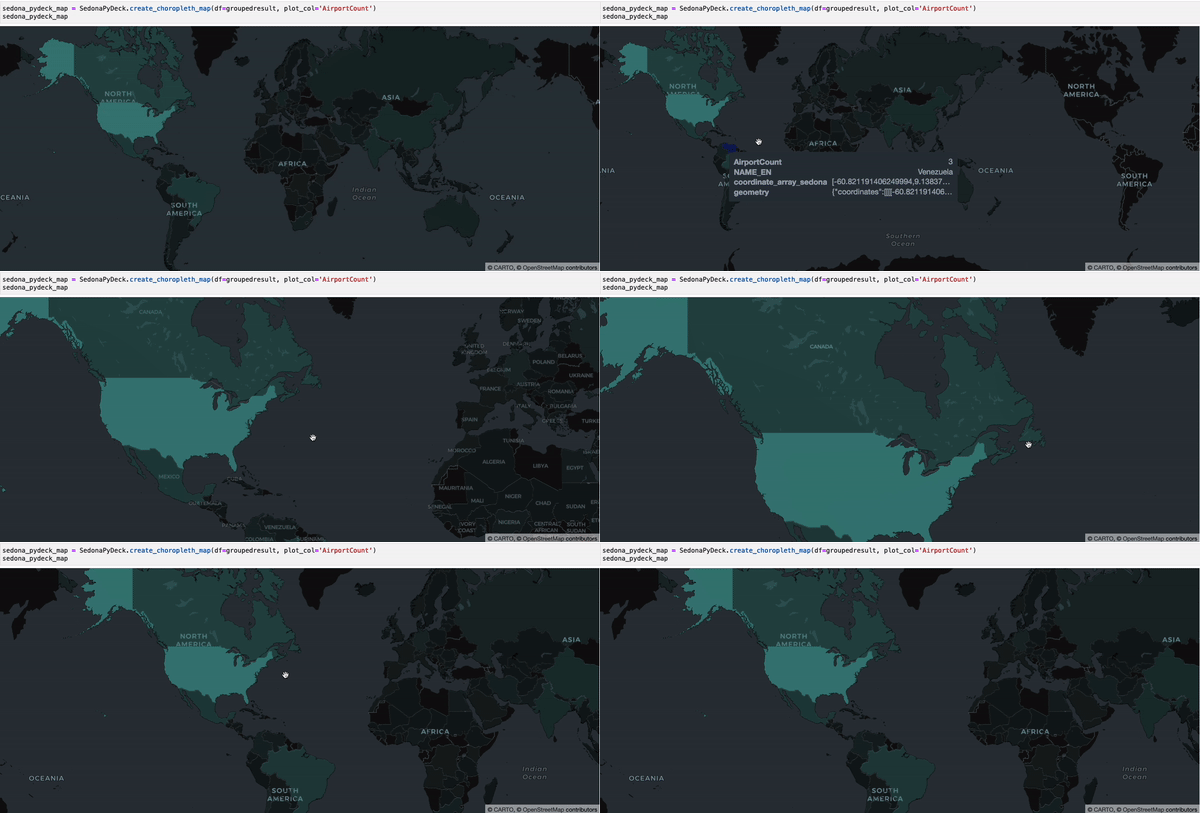 The dataset used is available [here](https://github.com/apache/sedona/tree/4c5fa8333b2c61850d5664b878df9493c7915066/binder/data/ne_50m_airports) and
can also be found in the example notebook available [here](https://github.com/apache/sedona/blob/4c5fa8333b2c61850d5664b878df9493c7915066/binder/ApacheSedonaSQL_SpatialJoin_AirportsPerCountry.ipynb)
### Creating a Geometry map using SedonaPyDeck
`SedonaPyDeck` exposes a `create_geometry_map` API which can be used to visualize a passed `SedonaDataFrame` containing any type of geometries:
Example (referenced from overture notebook available via binder):
```python theme={"system"}
SedonaPyDeck.create_geometry_map(df_building, elevation_col='height')
```
The dataset used is available [here](https://github.com/apache/sedona/tree/4c5fa8333b2c61850d5664b878df9493c7915066/binder/data/ne_50m_airports) and
can also be found in the example notebook available [here](https://github.com/apache/sedona/blob/4c5fa8333b2c61850d5664b878df9493c7915066/binder/ApacheSedonaSQL_SpatialJoin_AirportsPerCountry.ipynb)
### Creating a Geometry map using SedonaPyDeck
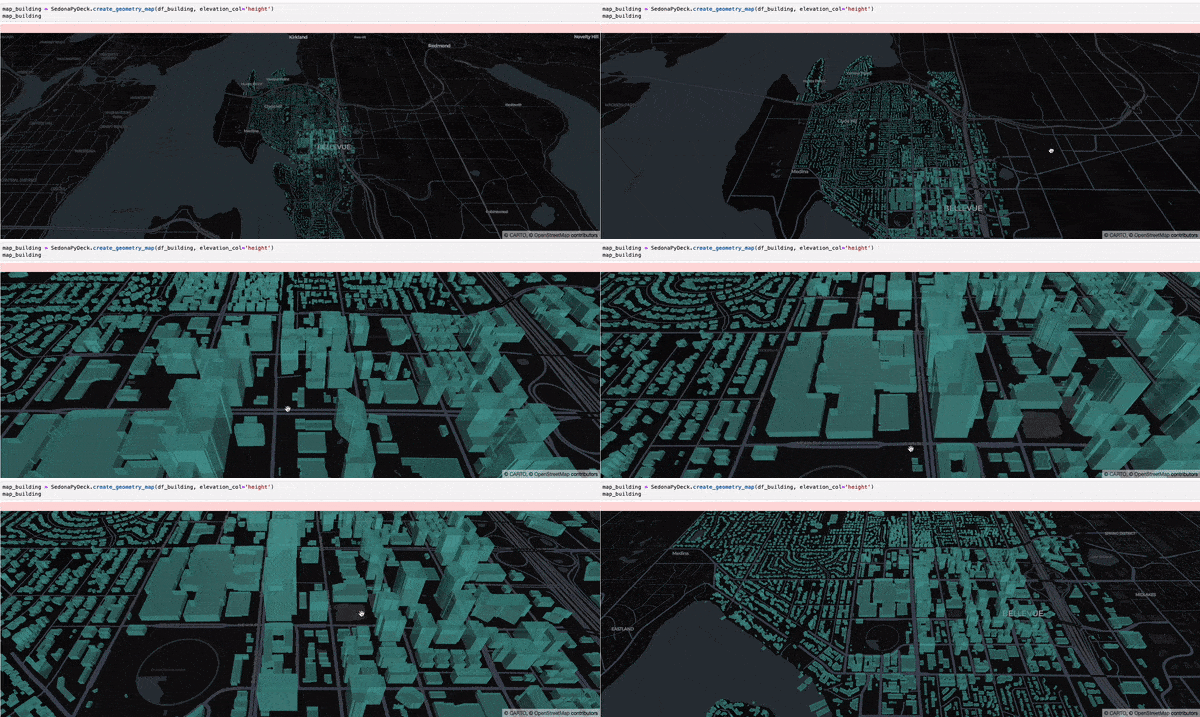
`SedonaPyDeck` exposes a `create_geometry_map` API which can be used to visualize a passed `SedonaDataFrame` containing any type of geometries:
Example (referenced from overture notebook available via binder):
```python theme={"system"}
SedonaPyDeck.create_geometry_map(df_building, elevation_col='height')
```
 ### Tip
`elevation_col` is an optional argument which can be used to render a 3D map. Pass the column with 'elevation' values for the geometries here.
### Creating a scatter plot using `SedonaPyDeck`
`SedonaPyDeck` exposes a `create_scatterplot_map` API which can be used to visualize a scatter plot out of the passed `SedonaDataFrame` containing points:
Example:
```python theme={"system"}
SedonaPyDeck.create_scatterplot_map(df=crimes_df)
```
### Tip
`elevation_col` is an optional argument which can be used to render a 3D map. Pass the column with 'elevation' values for the geometries here.
### Creating a scatter plot using `SedonaPyDeck`
`SedonaPyDeck` exposes a `create_scatterplot_map` API which can be used to visualize a scatter plot out of the passed `SedonaDataFrame` containing points:
Example:
```python theme={"system"}
SedonaPyDeck.create_scatterplot_map(df=crimes_df)
```
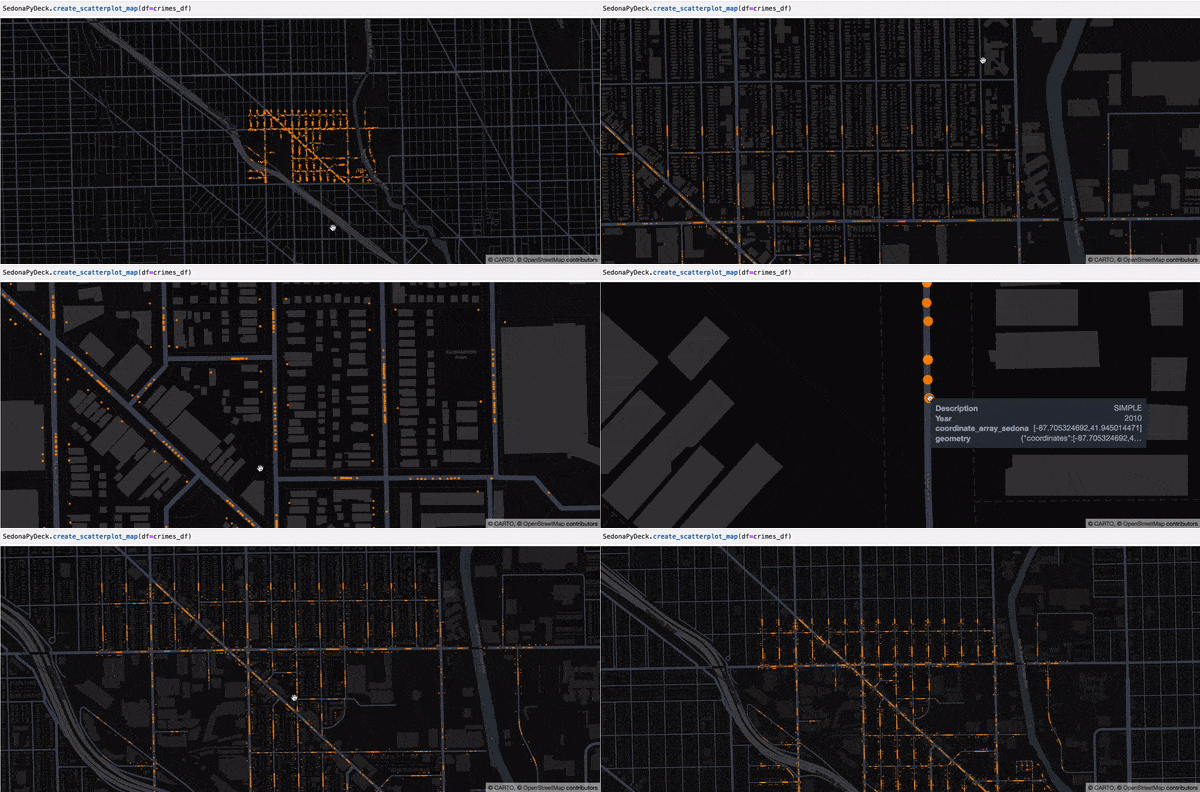 The dataset used here is the Chicago crimes dataset, available [here](https://github.com/apache/sedona/blob/sedona-1.5.0/spark/common/src/test/resources/Chicago_Crimes.csv)
### Creating a heatmap using SedonaPyDeck
`SedonaPyDeck` exposes a create\_heatmap API which can be used to visualize a heatmap out of the passed `SedonaDataFrame` containing points:
Example:
```python theme={"system"}
SedonaPyDeck.create_heatmap(df=crimes_df)
```
The dataset used here is the Chicago crimes dataset, available [here](https://github.com/apache/sedona/blob/sedona-1.5.0/spark/common/src/test/resources/Chicago_Crimes.csv)
### Creating a heatmap using SedonaPyDeck
`SedonaPyDeck` exposes a create\_heatmap API which can be used to visualize a heatmap out of the passed `SedonaDataFrame` containing points:
Example:
```python theme={"system"}
SedonaPyDeck.create_heatmap(df=crimes_df)
```
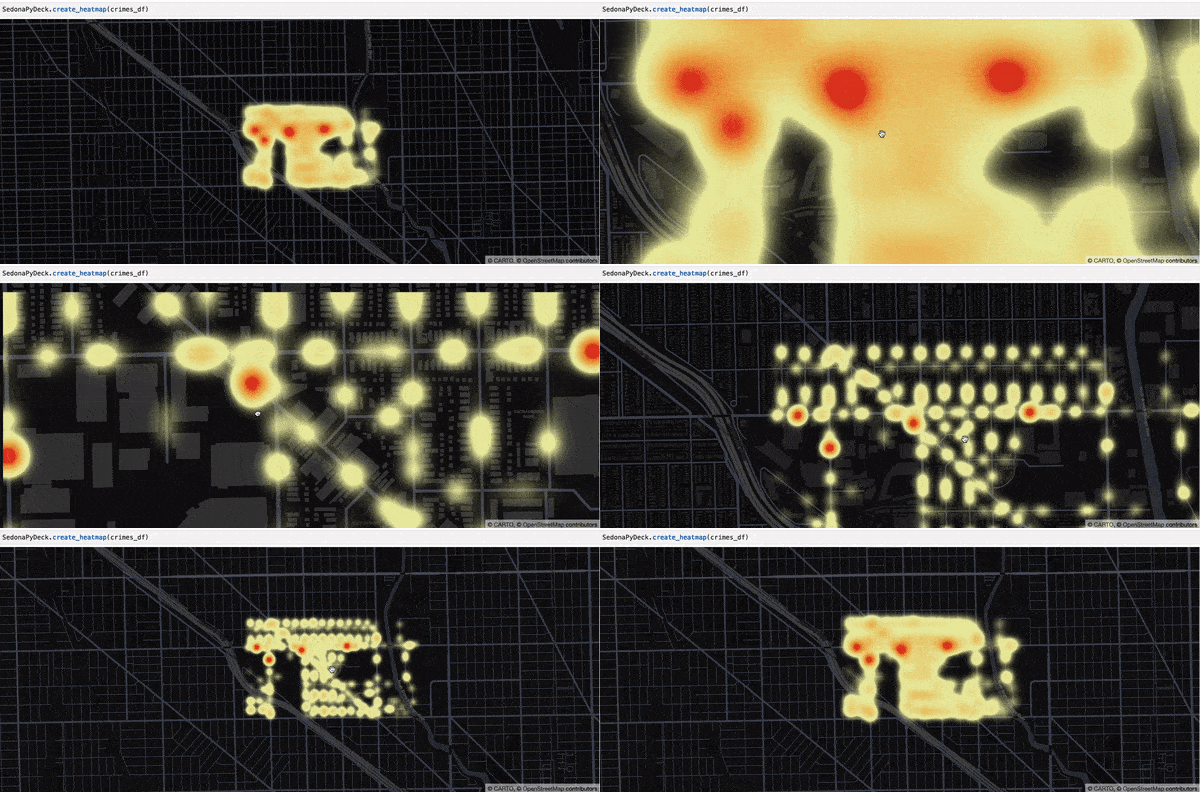 The dataset used here is the Chicago crimes dataset, available [here](https://github.com/apache/sedona/blob/sedona-1.5.0/spark/common/src/test/resources/Chicago_Crimes.csv)
## SedonaKepler
Spatial query results can be visualized in a Jupyter lab/notebook environment using `SedonaKepler`.
`SedonaKepler` exposes APIs to create interactive and customizable map visualizations using [KeplerGl](https://kepler.gl/).
This tutorial showcases how simple it is to instantly visualize geospatial data using `SedonaKepler`.
Example (referenced from an example notebook via the binder):
```python theme={"system"}
SedonaKepler.create_map(df=groupedresult, name="AirportCount")
```
The dataset used here is the Chicago crimes dataset, available [here](https://github.com/apache/sedona/blob/sedona-1.5.0/spark/common/src/test/resources/Chicago_Crimes.csv)
## SedonaKepler
Spatial query results can be visualized in a Jupyter lab/notebook environment using `SedonaKepler`.
`SedonaKepler` exposes APIs to create interactive and customizable map visualizations using [KeplerGl](https://kepler.gl/).
This tutorial showcases how simple it is to instantly visualize geospatial data using `SedonaKepler`.
Example (referenced from an example notebook via the binder):
```python theme={"system"}
SedonaKepler.create_map(df=groupedresult, name="AirportCount")
```
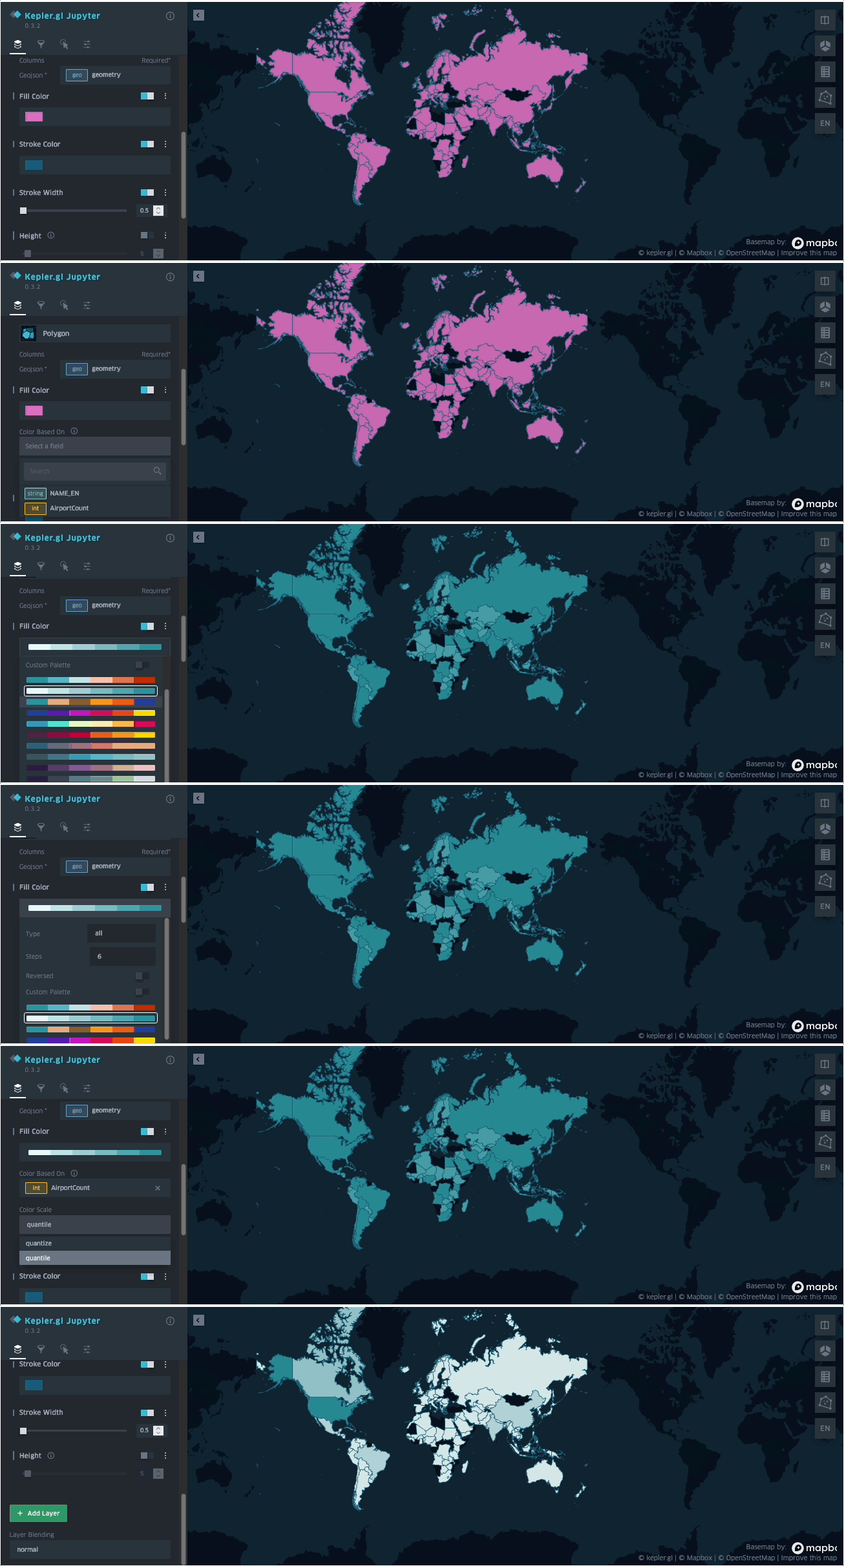 The dataset used is available [here](https://github.com/apache/sedona/tree/4c5fa8333b2c61850d5664b878df9493c7915066/binder/data/ne_50m_airports) and
can also be found in the example notebook available [here](https://github.com/apache/sedona/blob/4c5fa8333b2c61850d5664b878df9493c7915066/binder/ApacheSedonaSQL_SpatialJoin_AirportsPerCountry.ipynb)
Details on all the APIs available by `SedonaKepler` are listed in the [`SedonaKepler` API docs](/reference/wherobots-db/geometry-data/visualization/visualization_sedona-kepler/)
The dataset used is available [here](https://github.com/apache/sedona/tree/4c5fa8333b2c61850d5664b878df9493c7915066/binder/data/ne_50m_airports) and
can also be found in the example notebook available [here](https://github.com/apache/sedona/blob/4c5fa8333b2c61850d5664b878df9493c7915066/binder/ApacheSedonaSQL_SpatialJoin_AirportsPerCountry.ipynb)
Details on all the APIs available by `SedonaKepler` are listed in the [`SedonaKepler` API docs](/reference/wherobots-db/geometry-data/visualization/visualization_sedona-kepler/)