> ## Documentation Index
> Fetch the complete documentation index at: https://docs.wherobots.com/llms.txt
> Use this file to discover all available pages before exploring further.
# Tile Generation
Vector tiles provide performant rendering of map data for large vector feature datasets across large regions and zoom
levels. Here's why, and when, they should be used:
* Vector tiles are designed for use in web maps, mobile apps, and desktop GIS software.
* WherobotsDB makes it easy and affordable to generate vector tiles at a planetary scale.
* By rendering vector tiles directly, the interactive map experience is more responsive and scalable for large datasets
than rendering feature formats (e.g., GeoJSON) directly and allows developers to customize the display, which is
otherwise impossible with raster tiles.
In this tutorial, we will create PMTiles vector tiles for rendering maps using building and road data from the **Overture
Maps Dataset**. This dataset is located in the [`wherobots_open_data`](https://cloud.wherobots.com/data-hub?catalog=2rk2zjbg7pl6f8lb7xkzv) section of the Wherobots Cloud **Data Hub**.
## Start a WBC Notebook
Follow [these instructions](/develop/notebook-management/notebook-instance-management/) to open a notebook in
Wherobots Cloud. Once a notebook is started you can open the tile\_generation\_example notebook located in
`notebooks_examples/python` or `notebooks_examples/scala` in Jupyter lab, or create a new notebook tab in Jupyter lab
and select the desired kernel (Python or Scala) to follow this tutorial.
## Start a SedonaContext
As always, begin by starting a Sedona context
```python theme={"system"}
from sedona.spark import *
config = SedonaContext.builder().getOrCreate()
sedona = SedonaContext.create(config)
```
```scala theme={"system"}
import org.apache.sedona.spark.SedonaContext
val config = SedonaContext.builder().getOrCreate()
val sedona = SedonaContext.create(config)
```
## Load Feature Data
Create a Spatial DataFrame with a geometry column and a layer column. The geometry column contains the features to
render in the map. The layer column is a string that describes the grouping the feature should be in. Records within the
same layer can be styled together, independently of other layers. In this case example features that represent buildings
are in the buildings layer and those representing roads are in the roads layer.
The first cell that follows gives some variable to control where we generate tiles. The default is a small town in
Washington: Issaquah.
```python theme={"system"}
from sedona.spark import *
import pyspark.sql.functions as f
# Set to False to generate tiles for the entire dataset, True to generate only for region_wkt area
filter = True
region_wkt = "POLYGON ((-122.097931 47.538528, -122.048836 47.566566, -121.981888 47.510012, -122.057076 47.506302, -122.097931 47.538528))"
filter_expression = ST_Intersects(f.col("geometry"), ST_GeomFromText(f.lit(region_wkt)))
```
```scala theme={"system"}
import org.apache.spark.sql.sedona_sql.expressions.st_constructors.ST_GeomFromText
import org.apache.spark.sql.sedona_sql.expressions.st_predicates.ST_Intersects
import org.apache.spark.sql.functions.{lit, col}
// Set to False to generate tiles for the entire dataset, true to generate only for regionWkt area
val filter = true
val regionWkt = "POLYGON ((-122.097931 47.538528, -122.048836 47.566566, -121.981888 47.510012, -122.057076 47.506302, -122.097931 47.538528))"
val filterExpression = ST_Intersects(col("geometry"), ST_GeomFromText(lit(regionWkt)))
```
Next, we create the buildings Spatial DataFrame using the Overture buildings table from the Wherobots Open Data Catalog (`wherobots_open_data`).
```python theme={"system"}
buildings_df = (
sedona.table("wherobots_open_data.overture_maps_foundation.buildings_building")
.select(
f.col("geometry"),
f.lit("buildings").alias("layer"),
f.element_at(f.col("sources"), 1).dataset.alias("source")
)
)
buildings_df.show()
```
```scala theme={"system"}
import org.apache.spark.sql.functions.element_at
val buildingsDf = sedona.table("wherobots_open_data.overture_maps_foundation.buildings_building")
.select(
col("geometry"),
lit("buildings").alias("layer"),
element_at(col("sources"), 1)("dataset").alias("source")
)
buildingsDf.show()
```
Next, we create a Spatial DataFrame for our road features using the Overture transportation segment table.
```python theme={"system"}
roads_df = (
sedona.table("wherobots_open_data.overture_maps_foundation.transportation_segment")
.select(
f.col("geometry"),
f.lit("roads").alias("layer"),
f.element_at(f.col("sources"), 1).dataset.alias("source")
)
)
roads_df.show()
```
```scala theme={"system"}
val roadsDf = sedona.table("wherobots_open_data.overture_maps_foundation.transportation_segment")
.select(
col("geometry"),
lit("roads").alias("layer"),
element_at(col("sources"), 1)("dataset").alias("source")
)
roadsDf.show()
```
Next, we prepare a single spatial DataFrame combining our roads and buildings features.
```python theme={"system"}
features_df = roads_df.union(buildings_df)
if filter:
features_df = features_df.filter(ST_Intersects(f.col("geometry"), ST_GeomFromText(f.lit(region_wkt))))
features_df.count()
```
```scala theme={"system"}
var featuresDf = roadsDf.union(buildingsDf)
featuresDf = if (filter) featuresDf.filter(filterExpression) else featuresDf
featuresDf.count()
```
## Create Tiles as a PMTiles Archive
Once we have the Spatial DataFrame ready for tile generation, we can use the `vtiles.generate_pmtiles` method to create a PMTiles archive. PMTiles is a performant, simple, and optimized format for storing vector tiles.
Wherobots will automatically handle the details for you. However, if you need more control, a `GenerationConfig` object can optionally be provided as an argument to control which tiles are created and their contents. A `PMTilesConfig` object can optionally be provided to control the header information of the PMTiles Archive.
```python theme={"system"}
from wherobots import vtiles
import os
full_tiles_path = os.getenv("USER_S3_PATH") + "tiles.pmtiles"
vtiles.generate_pmtiles(features_df, full_tiles_path)
```
```scala theme={"system"}
import com.wherobots.VTiles
val fullTilesPath = sys.env("USER_S3_PATH") + "tiles.pmtiles"
val tilesDf = VTiles.generatePMTiles(featuresDf, fullTilesPath)
```
## Visualizing Vector Tiles with leafmap
We've made it easy to use [leafmap](https://leafmap.org/) to visualize the vector tiles we just generated. Leafmap is a popular
geospatial visualization tool for Jupyter notebooks.
Visualization is only available in Python.
We offer a function that makes it easy to use leafmap. This
function creates a signed URL, styles the tiles, and returns a Leafmap object. The function can be used as follows:
```python theme={"system"}
vtiles.show_pmtiles(full_tiles_path)
```
If you are not using the Wherobots provided bucket to store tiles, ensure CORS is enabled on the bucket. Learn
how to configure this in the
[CORS documentation](/tutorials/wherobotsdb/tile-generation/cors/).
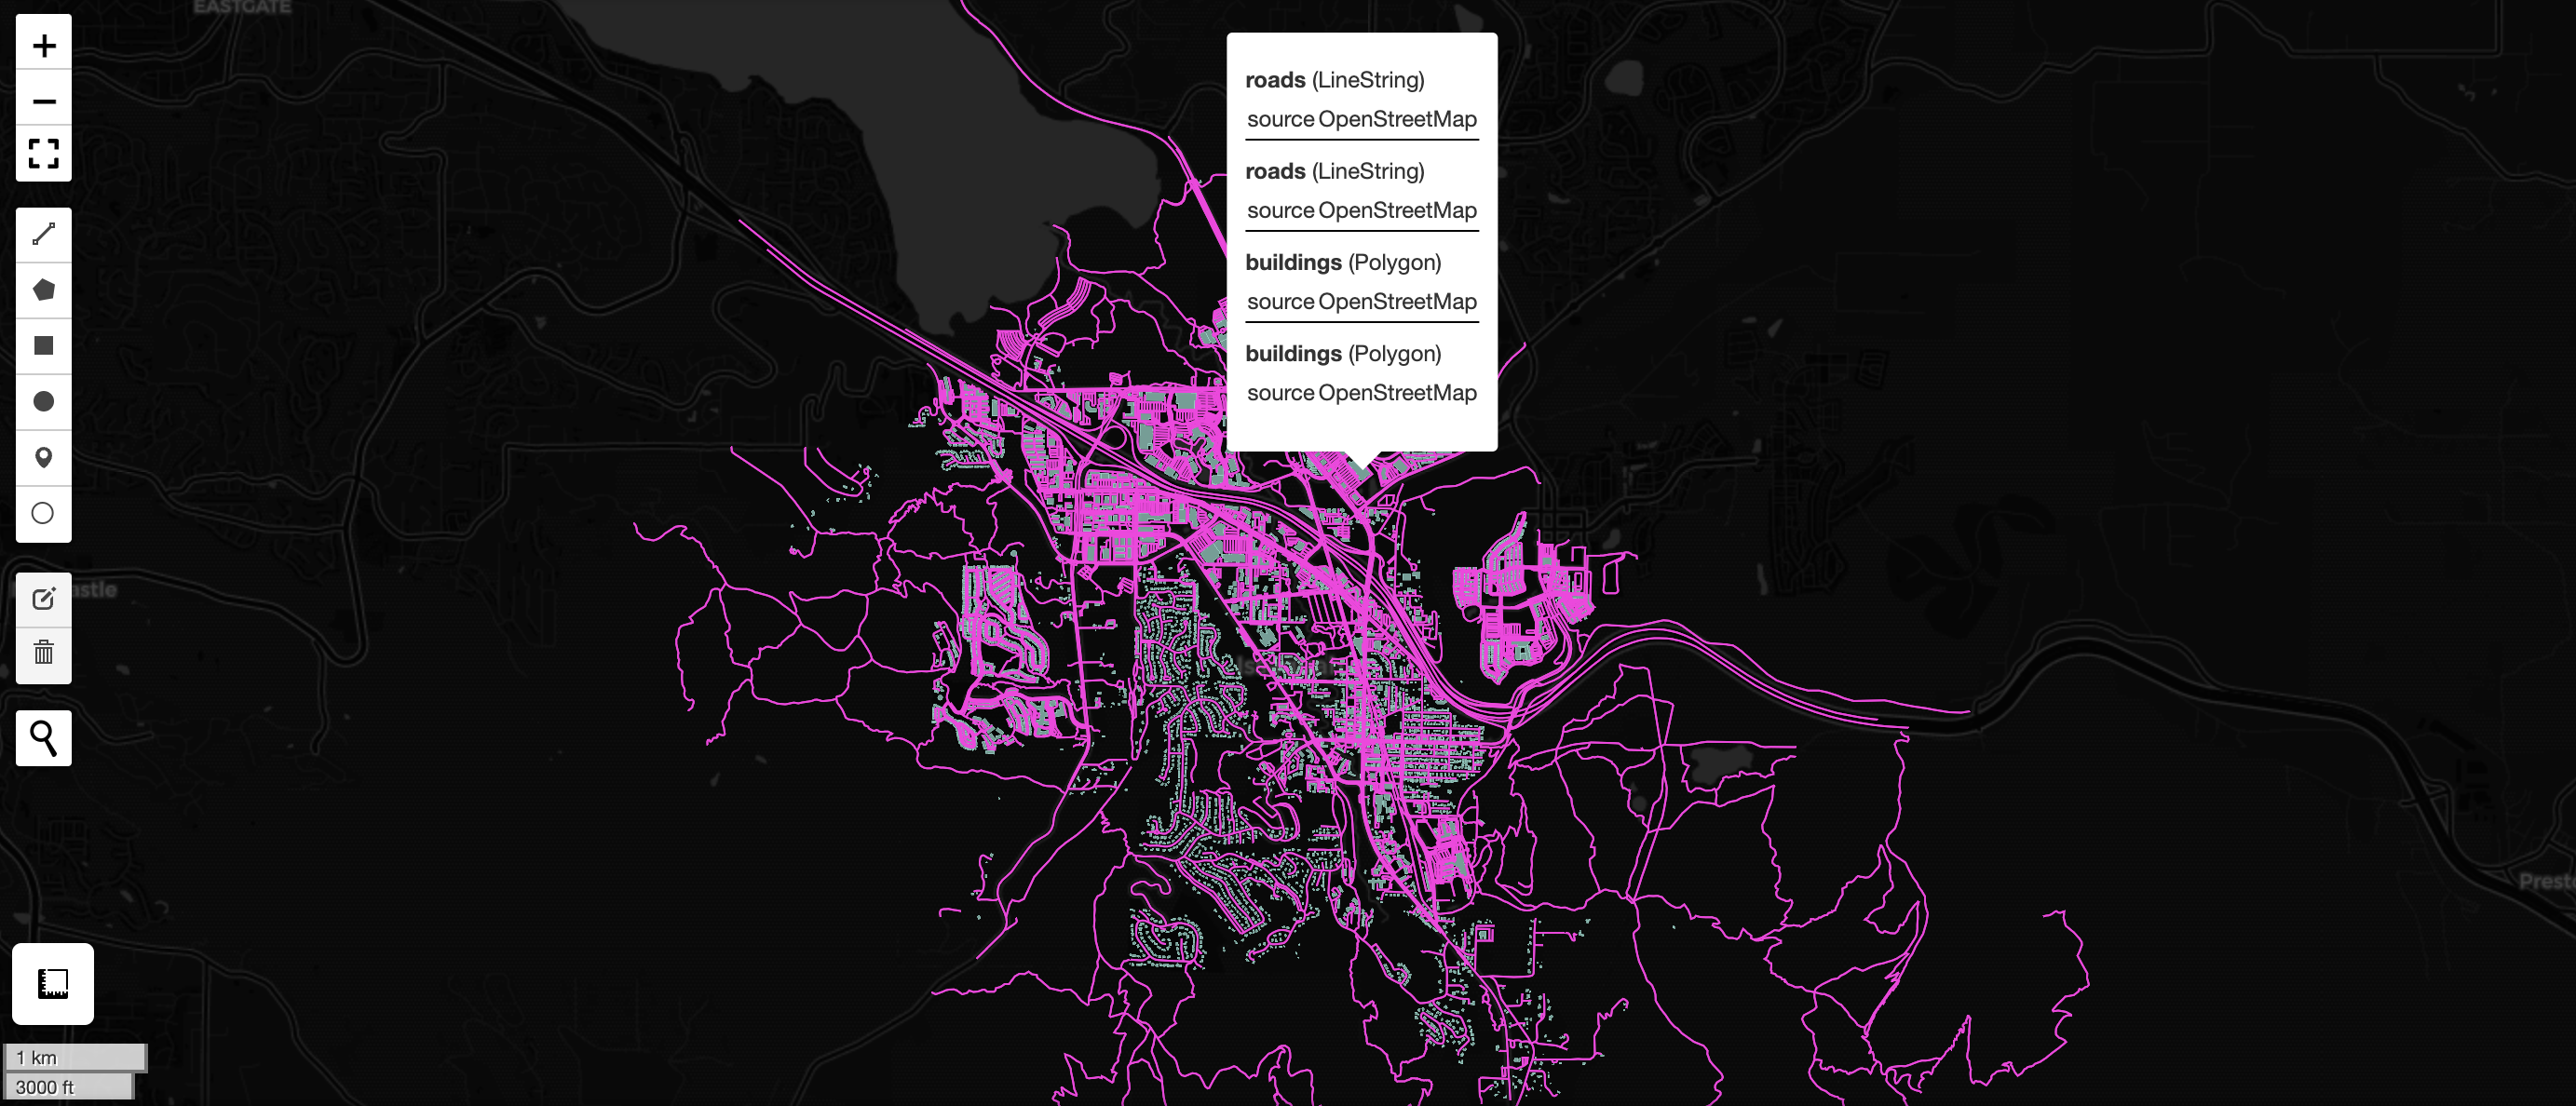
Here is an example visualizing the PMTiles we developed. Purple areas are road layers and green areas are building layers.
 ## Quick Generation of Tiles
Sometimes you want to quickly visualize a massive dataset. To achieve this goal, WherobotsDB provides a function for
quickly generating, saving, and displaying tiles.
This feature can be used as follows:
```python theme={"system"}
sample_tiles_path = os.getenv("USER_S3_PATH") + "sampleTiles.pmtiles"
vtiles.generate_quick_pmtiles(features_df, sample_tiles_path)
```
```scala theme={"system"}
val SampleTilesPath = sys.env("USER_S3_PATH") + "sampleTiles.pmtiles"
VTiles.generatePMTiles(featuresDf, SampleTilesPath, VTiles.getQuickConfig)
```
As a comprehensive map application toolbox, WherobotsDB provides many off-the-shelf scalable tools. In this
tutorial, we just focus on a minimum example. Detailed explanation of each tool can be found
at [References](/reference/wherobots-db/geometry-data/overview/).
## Quick Generation of Tiles
Sometimes you want to quickly visualize a massive dataset. To achieve this goal, WherobotsDB provides a function for
quickly generating, saving, and displaying tiles.
This feature can be used as follows:
```python theme={"system"}
sample_tiles_path = os.getenv("USER_S3_PATH") + "sampleTiles.pmtiles"
vtiles.generate_quick_pmtiles(features_df, sample_tiles_path)
```
```scala theme={"system"}
val SampleTilesPath = sys.env("USER_S3_PATH") + "sampleTiles.pmtiles"
VTiles.generatePMTiles(featuresDf, SampleTilesPath, VTiles.getQuickConfig)
```
As a comprehensive map application toolbox, WherobotsDB provides many off-the-shelf scalable tools. In this
tutorial, we just focus on a minimum example. Detailed explanation of each tool can be found
at [References](/reference/wherobots-db/geometry-data/overview/).