> ## Documentation Index
> Fetch the complete documentation index at: https://docs.wherobots.com/llms.txt
> Use this file to discover all available pages before exploring further.
# Visualize Data with Dekart
You can leverage Wherobots' scalable compute directly within [**Dekart**](https://dekart.xyz/docs/usage/wherobots-sql-tutorial/), an open-source tool that creates rich, interactive map visualizations from large-scale spatial SQL queries.
This integration allows you to run Wherobots-powered analysis and visualize your results on a map within the [Dekart](https://dekart.xyz/) platform.
## Benefits
The [**Dekart Integration**](https://cloud.dekart.xyz/) allows you to:
* **Directly Query Wherobots:** Run spatial SQL queries on your data in Wherobots without leaving the Dekart interface.
* **Visualize Large Datasets:** Render maps with hundreds of thousands or even millions of points and polygons.
* **Create Multi-Layer Maps:** Combine results from multiple queries as distinct layers on a single map to discover spatial relationships.
* **Collaborate and Share:** Securely share your interactive maps and insights with your team or make them public.
## Before you start
Before using this feature, ensure that you have the following required resources:
* An **Account** within a Community, Professional, Innovation, or Enterprise Edition Organization. For more information, see [Create a Wherobots Account](/get-started/wherobots-cloud/create-account/).
* Both **Admin** and **User** roles have access to this integration.
* A [Wherobots API key](/get-started/wherobots-cloud/api-keys/).
* A running workspace instance of Dekart. For more information or to create a Dekart Workspace, click **Create Free Workspace** on the [Dekart Website](https://dekart.xyz/cloud/).
* You must be an **Admin** of your Dekart Workspace to add a Connection. However, both Admins and Editors can execute queries once the connection is established.
## Connecting Dekart to Wherobots
To connect your Wherobots Organization to Dekart, do the following:
1. In Dekart, go to [**Connections**](https://cloud.dekart.xyz/connections).
2. Click **Add connection**.
3. Select **Wherobots** from the list of data sources.
4. In the connection dialog box, enter the following:
* **Connection Name:** A descriptive name for your connection.
* **Host:** This is pre-filled with the Wherobots API endpoint, `api.cloud.wherobots.com`.
* **API Key:** Paste your [Wherobots API Key](/get-started/wherobots-cloud/api-keys/).
* **Runtime:** Select the desired compute runtime size. Community Edition Organizations only have access to the **Tiny** and **Micro** runtimes.
* **Region:** Select your AWS region.
5. Click **Test Connection** to verify the details, then click **Save**.
You can confirm the connection in the [**Connections**](https://cloud.dekart.xyz/connections) section of Dekart.
## Selecting a data source
You have two main options for sourcing data with the Dekart integration:
1. **Use ready-to-query datasets:** If you have a Community Edition Organization, use our curated collection of datasets, available in the [Wherobots Data Hub](https://cloud.wherobots.com/data-hub).
This catalog includes popular open data sources like **Foursquare Places** and **Overture Maps** as well as proprietary datasets for Enterprise or Professional Edition Organizations.
2. **Connect your own data:** Analyze your business' data by connecting directly to your own data sources with our Amazon S3 Integration.
**Visualize data stored in S3**
Wherobots allows you to connect to your S3 data, making your data queryable while ensuring that your data remains within your own environment.
Connect your AWS S3 buckets to Wherobots using an [S3 Integration](/develop/storage-management/s3-storage-integration/) to securely analyze your data directly
from the source, with no need to move or copy it. After integrating your S3 bucket,
you can query tables in Dekart with Wherobots' compute.
## Querying data and automatically visualizing results
After saving the connection, you will be returned to the map view.
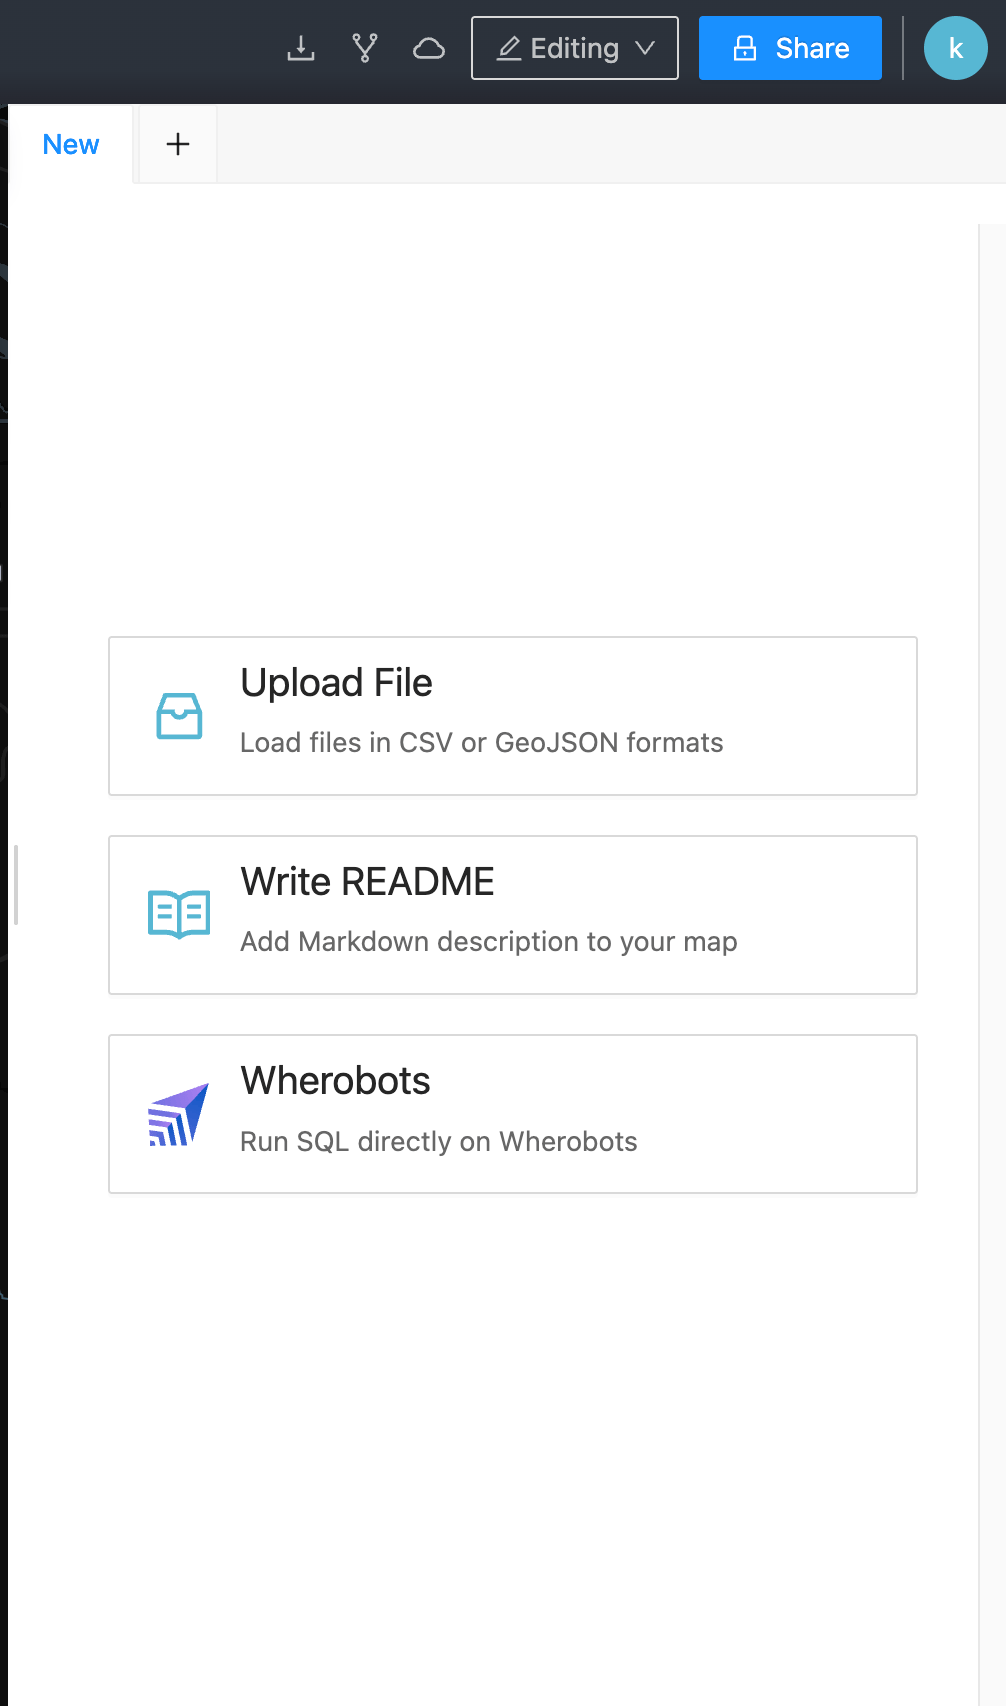
To write a query in Dekart, do the following:
1. Click **☰** > **New Map**.
2. Click on the **Wherobots** button in the right-hand panel to open the query editor.
3. Write your spatial SQL query in the editor.
To review an example query, see [Example query](#example-query).
4. Click the **Execute** button at the bottom right of the query editor. The query status will show as `pending`, then `running`.
When Dekart detects a `geometry` column in your results, it renders your map automatically.
If your data doesn't appear on the map automatically, you can still [manually plot your data](#plotting-data-from-non-geometry-inputs).
**Initial environment spin-up**
When you run your first query, Wherobots needs to spin up the compute environment.
This initial startup can take up to two minutes. Subsequent queries will be much faster.
### Plotting data from non-geometry inputs
Dekart will only plot your data automatically if your SQL query result includes a column with a `geometry` data type.
Dekart can still plot this data, but you need to manually tell it which columns to use.
To plot your data manually, do the following:
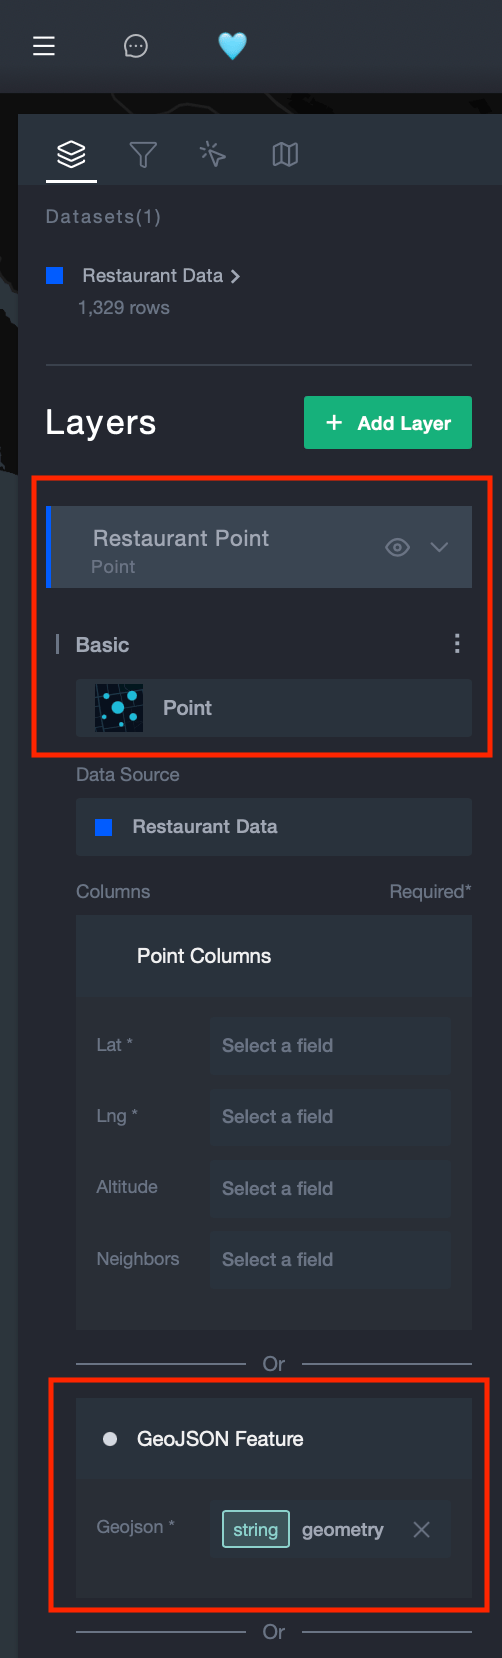
1. In the main interface, click **Add Layer** to create a new map layer.
2. Give the layer a descriptive **Name** (e.g., "Customer Locations," "Storefronts").
3. In the **Select a Type** dropdown, select the kind of data you will be plotting.
For example, choose **Point** as the layer type to plot individual coordinates.
4. Select the name of the tab that contains your SQL Query from the **Data Source** dropdown.
5. Tell Dekart which column(s) contain the appropriate geographic coordinates. You have two primary options:
* If your SQL query generates separate Latitude and Longitude columns:
* In the **Columns** section, locate the **Lat** and **Lng** fields.
* Select your latitude column for the **Lat** field.
* Select your longitude column for the **Lng** field.
* If your SQL query generates a single Geometry column (containing WKT or GeoJSON data):
* In the **Columns** section, find the option labeled **GeoJSON Feature**.
* Select this option.
* From the dropdown menu that appears, choose the column that contains your geometry data (e.g., a column named `geometry`, `wkt`, or `location`).
Once the geometry is correctly configured, your data points will be rendered on the map.
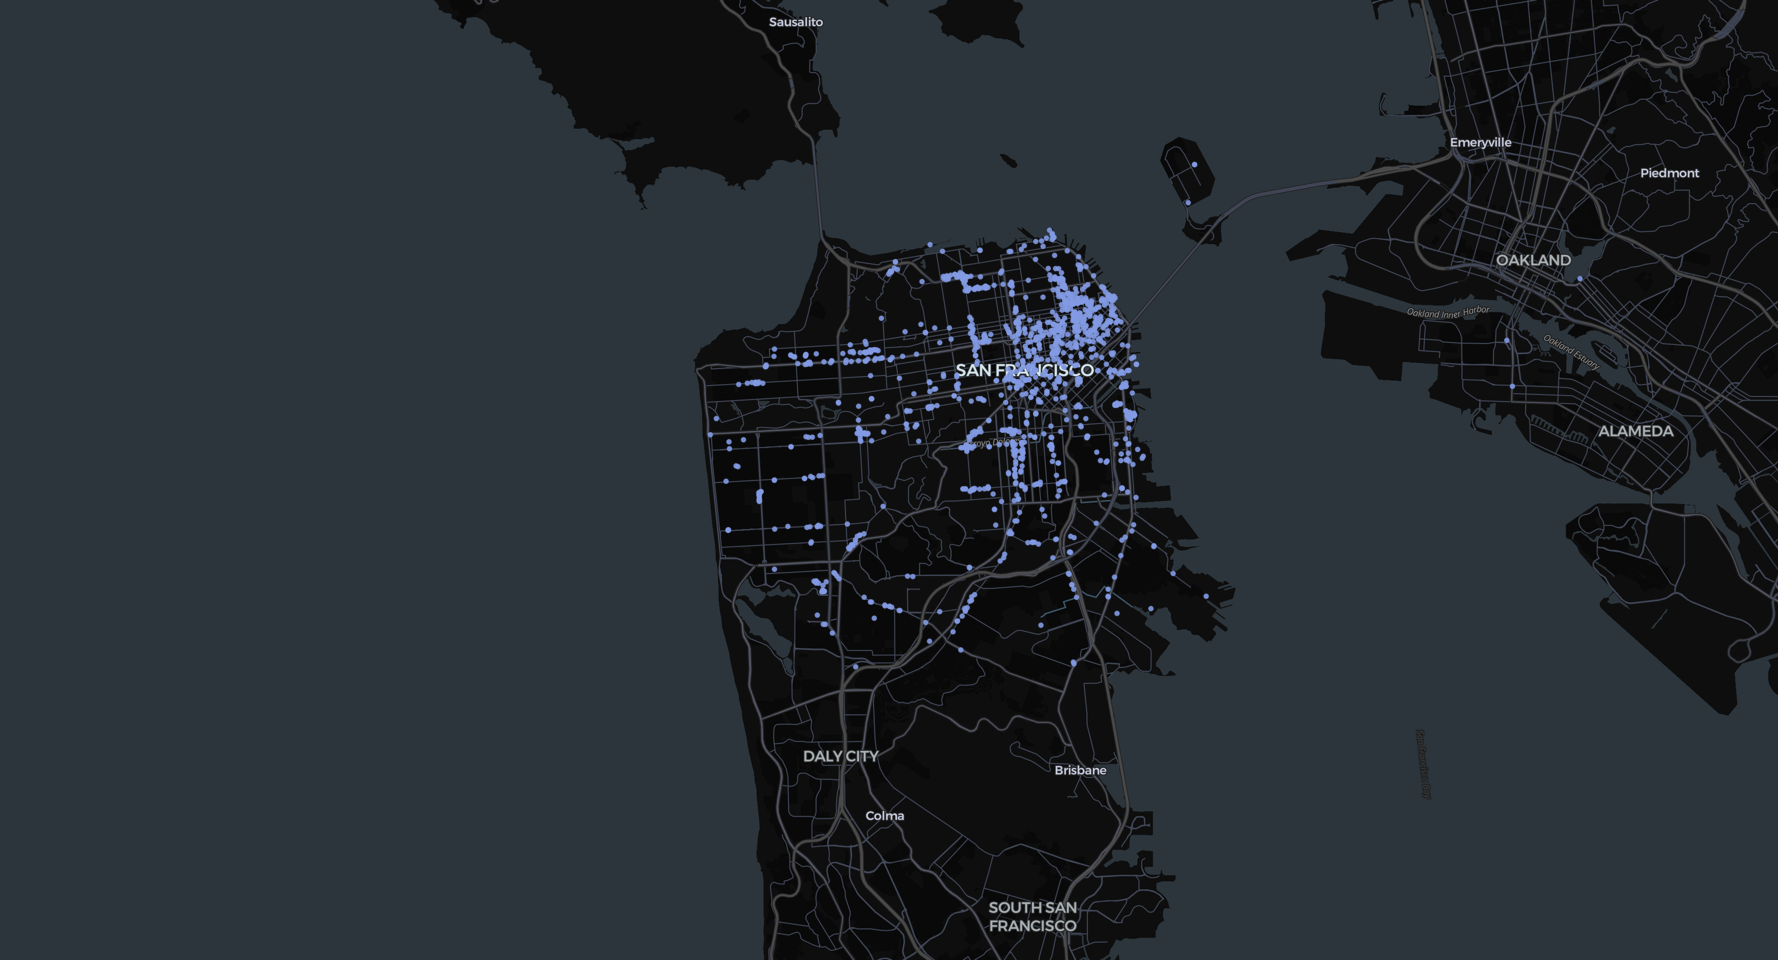
## Example query
This query identifies potential new restaurants by finding all food
and beverage establishments in San Francisco added to the dataset
since January 1, 2023.
You can execute the following query in Dekart:
```sql title="Example Dekart query" linenums="1" theme={"system"}
SELECT DISTINCT
p.geom as geometry,
p.name,
p.fsq_category_labels,
p.address
FROM
wherobots_open_data.foursquare.places p
LATERAL VIEW
explode(p.fsq_category_labels) t AS category_label
WHERE
p.locality = 'San Francisco'
AND p.date_created >= '2023-01-01'
AND p.region = 'CA'
AND t.category_label LIKE 'Dining and Drinking%'
```
When plotted, this query will return the following map:
You can use this query as a starting point. Paste it into Dekart and edit it to fit your business needs. 🚀
### How it works
* It filters for places in **San Francisco, CA**, established on or after **January 1, 2023**.
* The `LATERAL VIEW explode(...)` combined with `LIKE 'Dining and Drinking%'` finds all businesses in the `'Dining and Drinking'` [category and
its subcategories](https://docs.foursquare.com/data-products/docs/categories#places-open-source--propremium-flat-file) (like restaurants, bars, and cafés).
## Share your map
To share your new Dekart visualization, click the **Share** button at the top right of your map to configure sharing permissions and distribute your map.
## Best practices for writing queries
To ensure your spatial SQL queries run efficiently and visualize
correctly in Dekart, keep the following best practices in mind:
### Understand your data before you query
Before writing any query, it's essential to understand the structure and content of your data.
First, **review the table's schema** in the [Wherobots Data Hub](https://cloud.wherobots.com/data-hub). This will show you the exact column names (e.g., `fsq_category_labels`, `geom`) and their data types (`array`, `geometry`), which helps prevent simple syntax errors.
Next, when filtering by categories from datasets like Foursquare or Overture Maps, **consult their official documentation** to find the correct category names and understand their hierarchies. This is crucial for building accurate filters.
* **Foursquare:** [Categories List](https://docs.foursquare.com/data-products/docs/categories#places-open-source--propremium-flat-file)
* **Overture Maps:** [Categories List](https://github.com/OvertureMaps/schema/blob/main/docs/schema/concepts/by-theme/places/overture_categories.csv)
### Preserve the `geometry` data type
To ensure your results are automatically plotted on a map in Dekart, your query must return an unmodified `geometry` column.
Crucially, **avoid wrapping the `geometry` column in functions like `ST_AsEWKT()` or `ST_AsText()`**.
These functions convert the `geometry` object to text, removing the data type that Dekart needs for automatic visualization.
Think of the `geometry` type as a specialized binary format that's efficient for storage and spatial calculations; converting it to text loses that native structure.
### Build efficient filters
When searching text-based fields or hierarchical arrays, use wildcard characters and the `LATERAL VIEW` pattern.
* **Wildcard Searches:** Use the percent sign (`%`) in a `LIKE` clause as a wildcard to match any sequence of characters. For example, `LIKE '%Restaurant'` will find entries ending with "Restaurant".
* **Hierarchical Searches:** To query nested category data (e.g., finding all subcategories within a parent category), use the `LATERAL VIEW explode()` pattern. Combine this with a `LIKE` filter to match all entries that start with the parent category's name.
### Filter data within a custom area
To select data within a specific, non-circular area like a city neighborhood or a custom-defined zone, use a **spatial join**.
A spatial join combines two tables based on the spatial relationship between their geometries. The most common function for this is `ST_Contains`, which checks if one geometry is completely inside another. You can use it to join your points of interest with a table containing polygon boundaries.
For example, to filter for points within a polygon, your WHERE clause will use the following structure:
```sql theme={"system"}
# Contains placeholder values
WHERE ST_Contains(, )
```
In your query, replace the placeholder values with your specific table and column names.
 To write a query in Dekart, do the following:
1. Click **☰** > **New Map**.
2. Click on the **Wherobots** button in the right-hand panel to open the query editor.
3. Write your spatial SQL query in the editor.
To review an example query, see [Example query](#example-query).
4. Click the **Execute** button at the bottom right of the query editor. The query status will show as `pending`, then `running`.
When Dekart detects a `geometry` column in your results, it renders your map automatically.
If your data doesn't appear on the map automatically, you can still [manually plot your data](#plotting-data-from-non-geometry-inputs).
To write a query in Dekart, do the following:
1. Click **☰** > **New Map**.
2. Click on the **Wherobots** button in the right-hand panel to open the query editor.
3. Write your spatial SQL query in the editor.
To review an example query, see [Example query](#example-query).
4. Click the **Execute** button at the bottom right of the query editor. The query status will show as `pending`, then `running`.
When Dekart detects a `geometry` column in your results, it renders your map automatically.
If your data doesn't appear on the map automatically, you can still [manually plot your data](#plotting-data-from-non-geometry-inputs).
 2. Give the layer a descriptive **Name** (e.g., "Customer Locations," "Storefronts").
3. In the **Select a Type** dropdown, select the kind of data you will be plotting.
For example, choose **Point** as the layer type to plot individual coordinates.
4. Select the name of the tab that contains your SQL Query from the **Data Source** dropdown.
5. Tell Dekart which column(s) contain the appropriate geographic coordinates. You have two primary options:
* If your SQL query generates separate Latitude and Longitude columns:
* In the **Columns** section, locate the **Lat** and **Lng** fields.
* Select your latitude column for the **Lat** field.
* Select your longitude column for the **Lng** field.
* If your SQL query generates a single Geometry column (containing WKT or GeoJSON data):
* In the **Columns** section, find the option labeled **GeoJSON Feature**.
* Select this option.
* From the dropdown menu that appears, choose the column that contains your geometry data (e.g., a column named `geometry`, `wkt`, or `location`).
Once the geometry is correctly configured, your data points will be rendered on the map.
## Example query
This query identifies potential new restaurants by finding all food
and beverage establishments in San Francisco added to the dataset
since January 1, 2023.
You can execute the following query in Dekart:
```sql title="Example Dekart query" linenums="1" theme={"system"}
SELECT DISTINCT
p.geom as geometry,
p.name,
p.fsq_category_labels,
p.address
FROM
wherobots_open_data.foursquare.places p
LATERAL VIEW
explode(p.fsq_category_labels) t AS category_label
WHERE
p.locality = 'San Francisco'
AND p.date_created >= '2023-01-01'
AND p.region = 'CA'
AND t.category_label LIKE 'Dining and Drinking%'
```
When plotted, this query will return the following map:
2. Give the layer a descriptive **Name** (e.g., "Customer Locations," "Storefronts").
3. In the **Select a Type** dropdown, select the kind of data you will be plotting.
For example, choose **Point** as the layer type to plot individual coordinates.
4. Select the name of the tab that contains your SQL Query from the **Data Source** dropdown.
5. Tell Dekart which column(s) contain the appropriate geographic coordinates. You have two primary options:
* If your SQL query generates separate Latitude and Longitude columns:
* In the **Columns** section, locate the **Lat** and **Lng** fields.
* Select your latitude column for the **Lat** field.
* Select your longitude column for the **Lng** field.
* If your SQL query generates a single Geometry column (containing WKT or GeoJSON data):
* In the **Columns** section, find the option labeled **GeoJSON Feature**.
* Select this option.
* From the dropdown menu that appears, choose the column that contains your geometry data (e.g., a column named `geometry`, `wkt`, or `location`).
Once the geometry is correctly configured, your data points will be rendered on the map.
## Example query
This query identifies potential new restaurants by finding all food
and beverage establishments in San Francisco added to the dataset
since January 1, 2023.
You can execute the following query in Dekart:
```sql title="Example Dekart query" linenums="1" theme={"system"}
SELECT DISTINCT
p.geom as geometry,
p.name,
p.fsq_category_labels,
p.address
FROM
wherobots_open_data.foursquare.places p
LATERAL VIEW
explode(p.fsq_category_labels) t AS category_label
WHERE
p.locality = 'San Francisco'
AND p.date_created >= '2023-01-01'
AND p.region = 'CA'
AND t.category_label LIKE 'Dining and Drinking%'
```
When plotted, this query will return the following map:
 You can use this query as a starting point. Paste it into Dekart and edit it to fit your business needs. 🚀
### How it works
* It filters for places in **San Francisco, CA**, established on or after **January 1, 2023**.
* The `LATERAL VIEW explode(...)` combined with `LIKE 'Dining and Drinking%'` finds all businesses in the `'Dining and Drinking'` [category and
its subcategories](https://docs.foursquare.com/data-products/docs/categories#places-open-source--propremium-flat-file) (like restaurants, bars, and cafés).
## Share your map
To share your new Dekart visualization, click the **Share** button at the top right of your map to configure sharing permissions and distribute your map.
## Best practices for writing queries
To ensure your spatial SQL queries run efficiently and visualize
correctly in Dekart, keep the following best practices in mind:
### Understand your data before you query
Before writing any query, it's essential to understand the structure and content of your data.
First, **review the table's schema** in the [Wherobots Data Hub](https://cloud.wherobots.com/data-hub). This will show you the exact column names (e.g., `fsq_category_labels`, `geom`) and their data types (`array`, `geometry`), which helps prevent simple syntax errors.
Next, when filtering by categories from datasets like Foursquare or Overture Maps, **consult their official documentation** to find the correct category names and understand their hierarchies. This is crucial for building accurate filters.
* **Foursquare:** [Categories List](https://docs.foursquare.com/data-products/docs/categories#places-open-source--propremium-flat-file)
* **Overture Maps:** [Categories List](https://github.com/OvertureMaps/schema/blob/main/docs/schema/concepts/by-theme/places/overture_categories.csv)
### Preserve the `geometry` data type
To ensure your results are automatically plotted on a map in Dekart, your query must return an unmodified `geometry` column.
Crucially, **avoid wrapping the `geometry` column in functions like `ST_AsEWKT()` or `ST_AsText()`**.
These functions convert the `geometry` object to text, removing the data type that Dekart needs for automatic visualization.
Think of the `geometry` type as a specialized binary format that's efficient for storage and spatial calculations; converting it to text loses that native structure.
### Build efficient filters
When searching text-based fields or hierarchical arrays, use wildcard characters and the `LATERAL VIEW` pattern.
* **Wildcard Searches:** Use the percent sign (`%`) in a `LIKE` clause as a wildcard to match any sequence of characters. For example, `LIKE '%Restaurant'` will find entries ending with "Restaurant".
* **Hierarchical Searches:** To query nested category data (e.g., finding all subcategories within a parent category), use the `LATERAL VIEW explode()` pattern. Combine this with a `LIKE` filter to match all entries that start with the parent category's name.
### Filter data within a custom area
To select data within a specific, non-circular area like a city neighborhood or a custom-defined zone, use a **spatial join**.
A spatial join combines two tables based on the spatial relationship between their geometries. The most common function for this is `ST_Contains`, which checks if one geometry is completely inside another. You can use it to join your points of interest with a table containing polygon boundaries.
For example, to filter for points within a polygon, your WHERE clause will use the following structure:
```sql theme={"system"}
# Contains placeholder values
WHERE ST_Contains(
You can use this query as a starting point. Paste it into Dekart and edit it to fit your business needs. 🚀
### How it works
* It filters for places in **San Francisco, CA**, established on or after **January 1, 2023**.
* The `LATERAL VIEW explode(...)` combined with `LIKE 'Dining and Drinking%'` finds all businesses in the `'Dining and Drinking'` [category and
its subcategories](https://docs.foursquare.com/data-products/docs/categories#places-open-source--propremium-flat-file) (like restaurants, bars, and cafés).
## Share your map
To share your new Dekart visualization, click the **Share** button at the top right of your map to configure sharing permissions and distribute your map.
## Best practices for writing queries
To ensure your spatial SQL queries run efficiently and visualize
correctly in Dekart, keep the following best practices in mind:
### Understand your data before you query
Before writing any query, it's essential to understand the structure and content of your data.
First, **review the table's schema** in the [Wherobots Data Hub](https://cloud.wherobots.com/data-hub). This will show you the exact column names (e.g., `fsq_category_labels`, `geom`) and their data types (`array`, `geometry`), which helps prevent simple syntax errors.
Next, when filtering by categories from datasets like Foursquare or Overture Maps, **consult their official documentation** to find the correct category names and understand their hierarchies. This is crucial for building accurate filters.
* **Foursquare:** [Categories List](https://docs.foursquare.com/data-products/docs/categories#places-open-source--propremium-flat-file)
* **Overture Maps:** [Categories List](https://github.com/OvertureMaps/schema/blob/main/docs/schema/concepts/by-theme/places/overture_categories.csv)
### Preserve the `geometry` data type
To ensure your results are automatically plotted on a map in Dekart, your query must return an unmodified `geometry` column.
Crucially, **avoid wrapping the `geometry` column in functions like `ST_AsEWKT()` or `ST_AsText()`**.
These functions convert the `geometry` object to text, removing the data type that Dekart needs for automatic visualization.
Think of the `geometry` type as a specialized binary format that's efficient for storage and spatial calculations; converting it to text loses that native structure.
### Build efficient filters
When searching text-based fields or hierarchical arrays, use wildcard characters and the `LATERAL VIEW` pattern.
* **Wildcard Searches:** Use the percent sign (`%`) in a `LIKE` clause as a wildcard to match any sequence of characters. For example, `LIKE '%Restaurant'` will find entries ending with "Restaurant".
* **Hierarchical Searches:** To query nested category data (e.g., finding all subcategories within a parent category), use the `LATERAL VIEW explode()` pattern. Combine this with a `LIKE` filter to match all entries that start with the parent category's name.
### Filter data within a custom area
To select data within a specific, non-circular area like a city neighborhood or a custom-defined zone, use a **spatial join**.
A spatial join combines two tables based on the spatial relationship between their geometries. The most common function for this is `ST_Contains`, which checks if one geometry is completely inside another. You can use it to join your points of interest with a table containing polygon boundaries.
For example, to filter for points within a polygon, your WHERE clause will use the following structure:
```sql theme={"system"}
# Contains placeholder values
WHERE ST_Contains(