> ## Documentation Index
> Fetch the complete documentation index at: https://docs.wherobots.com/llms.txt
> Use this file to discover all available pages before exploring further.
# Workload History
> Learn how to monitor and analyze your workloads in Wherobots Cloud using the Workload History feature
export const FontColor = ({color, children}) => {
return {children};
};
In Wherobots Cloud, [**Workload History**](https://cloud.wherobots.com/workloads) allows you to monitor the progress of workloads (notebooks, SQL sessions, and job runs), understand resource consumption, review the execution timeline, and verify configuration settings.
## Benefits
The [**Workload History**](https://cloud.wherobots.com/workloads) section of Wherobots Cloud allows you to view all executed workloads within your Wherobots Organization and manage job runs.
Monitor Notebooks, Job Runs, and SQL Sessions to understand how resources are being used across your organization.
Spot trends for capacity planning and optimization by reviewing historical workload activity.
Stay aware of your organization's quota consumption to avoid hitting computational limits.
Pinpoint the source of unexpected resource usage and analyze spikes in activity.
Review activity by user or service principal to understand contributions and workload distribution.
Use workload insights to guide resource allocation and optimize costs for your organization.
You can review and filter any workloads executed within your Wherobots Organization.
## Before you start
Before using this feature, ensure that you have the following required resources:
* An **Admin** or **User** **Account** within a Professional, Innovation, or Enterprise Edition Organization. For more information, see [Create a Wherobots Account](/get-started/wherobots-cloud/create-account).
## View Notebook, Job Run, and SQL Session workloads
For insight into your workload trends and individual Job Runs, go to [**Workload History**](https://cloud.wherobots.com/workloads) in the left sidebar of Wherobots Cloud.
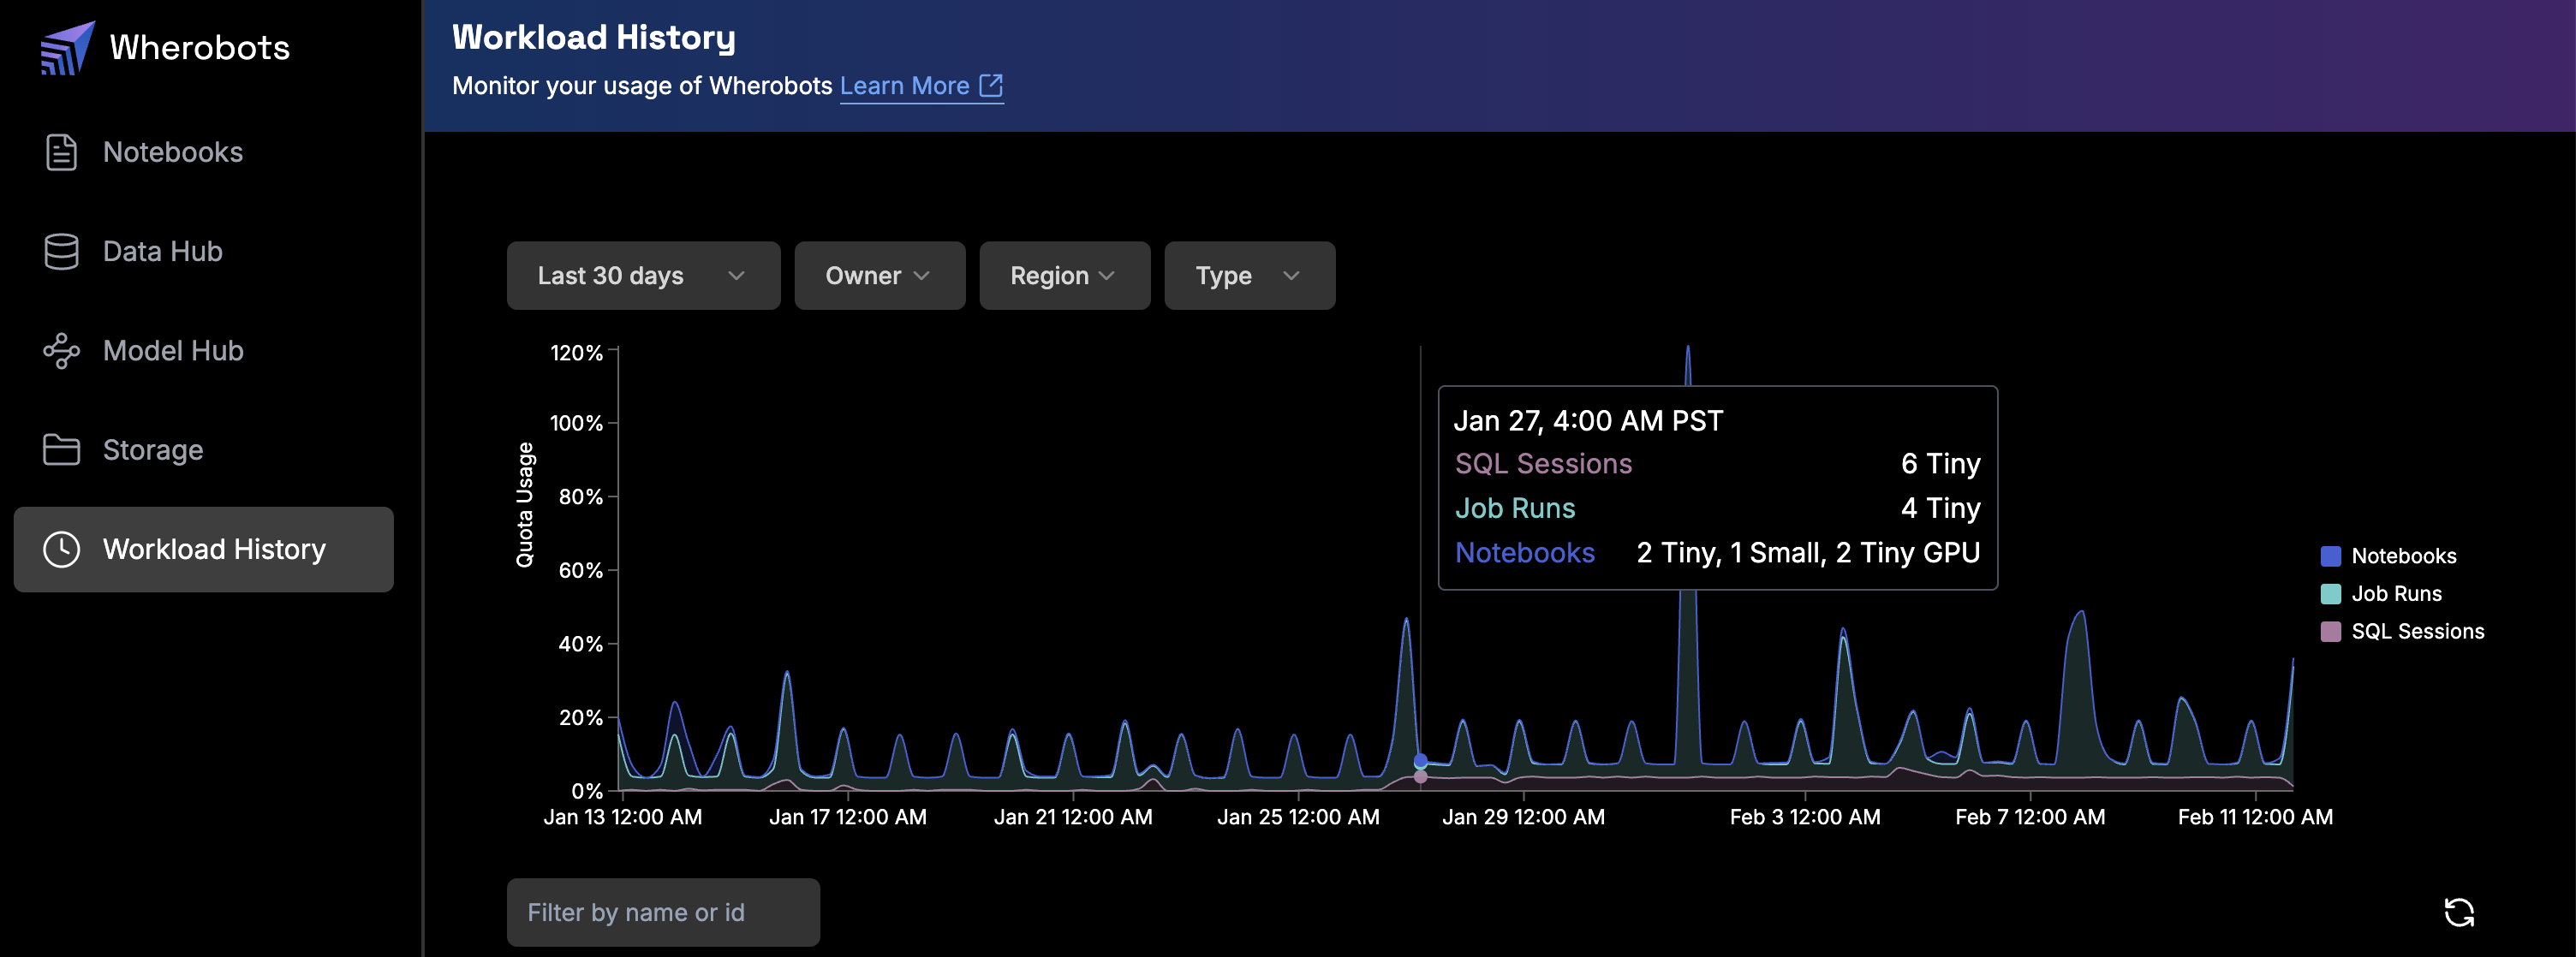 **Hover for details** — Place your cursor over any point on the chart to display a tooltip with the exact quota usage breakdown at that moment.
Use this to investigate any spikes or trends in resource consumption.
## Workload history overview
Workload History provides two main views to analyze your workloads: [**Chart**](#chart-view) and [**Table**](#table-view).
### Chart view
In chart view, you can see an overview of all your workloads, including Notebooks, Job Runs, and SQL Sessions. The chart displays quota usage as a percentage of your organization's total computing power over time.
In Wherobots Cloud, go to [**Workload History**](https://cloud.wherobots.com/workloads).
The chart displays **Quota Usage** as a percentage on the y-axis over the selected time range on the x-axis. Each area on the chart is color-coded by workload type:
The legend on the right side of the chart identifies each workload type by color.
View workloads from the last 24 hours, 7 days, 30 days, 60 days, or 90 days.
Filter workloads by the Organization member or service principal that started them
Filter workloads by the AWS region where they ran (e.g., aws-us-west-2, aws-eu-west-1, aws-us-east-1, etc.)
Filter workloads by type: Notebooks, Job Runs, or SQL Sessions
If you hover over the chart, you can see a breakdown of quota usage over time for Notebooks, Job Runs, and SQL Sessions.
Each workload type is color-coded for easy identification:
* **Notebooks** (blue)
* **Job Runs** (purple)
* **SQL Sessions** (green)
### Table view
The table view provides a detailed list of all workloads executed within your Wherobots Organization, along with key information about each workload.
**Hover for details** — Place your cursor over any point on the chart to display a tooltip with the exact quota usage breakdown at that moment.
Use this to investigate any spikes or trends in resource consumption.
## Workload history overview
Workload History provides two main views to analyze your workloads: [**Chart**](#chart-view) and [**Table**](#table-view).
### Chart view
In chart view, you can see an overview of all your workloads, including Notebooks, Job Runs, and SQL Sessions. The chart displays quota usage as a percentage of your organization's total computing power over time.
In Wherobots Cloud, go to [**Workload History**](https://cloud.wherobots.com/workloads).
The chart displays **Quota Usage** as a percentage on the y-axis over the selected time range on the x-axis. Each area on the chart is color-coded by workload type:
The legend on the right side of the chart identifies each workload type by color.
View workloads from the last 24 hours, 7 days, 30 days, 60 days, or 90 days.
Filter workloads by the Organization member or service principal that started them
Filter workloads by the AWS region where they ran (e.g., aws-us-west-2, aws-eu-west-1, aws-us-east-1, etc.)
Filter workloads by type: Notebooks, Job Runs, or SQL Sessions
If you hover over the chart, you can see a breakdown of quota usage over time for Notebooks, Job Runs, and SQL Sessions.
Each workload type is color-coded for easy identification:
* **Notebooks** (blue)
* **Job Runs** (purple)
* **SQL Sessions** (green)
### Table view
The table view provides a detailed list of all workloads executed within your Wherobots Organization, along with key information about each workload.
 The Table view includes the following elements:
The name or ID of the workload.
For **Notebook** and **SQL Session** workloads, click the workload name to copy its underlying workload ID to your clipboard. A tooltip displays the ID inline. This is useful when you need the ID for support or debugging, since these workload types do not have a separate detail page on Wherobots Cloud, like **Job Runs** do.
The entity that triggered the workload (Service Principal or User).
If your account is configured to the **User** role, and you use a [service principal](/get-started/wherobots-cloud/service-principals)-managed API key generated by an **Admin** in your Wherobots Organization, actions are attributed to the service principal in [**Audit Logs**](https://cloud.wherobots.com/organization/audit-logs), with the Admin shown as responsible solely for the API key creation.
The total duration of the workload.
The date and time when the workload completed, or "Running" status.
The AWS region where the workload executed.
The runtime size used (e.g., Tiny, Small, Medium, Large).
The estimated cost of the workload.
Spatial Units consumed by the workload so far. This information can be delayed by up to 20 minutes.
### Filter workloads
To locate specific workloads, you can use multiple filters:
1. Navigate to [**Workload History**](https://cloud.wherobots.com/workloads).
2. Use the **Filter by name or id** field to search for specific workloads.
3. Apply filters for **Time Range**, **Owner**, **Region**, or **Type** as needed.
## Manage Job Runs
In the [**Workload History**](https://cloud.wherobots.com/workloads) view, click on any Job Run workload row to view more information about that specific execution.
The detail page includes two tabs: **Details** and **Logs**.
### Details tab
The **Details** tab provides an overview of the Job Run’s configuration, runtime environment, and execution metadata so you can:
* Review Spark version, runtime size, and environment details
* Verify scheduling, trigger source, and timeout configuration
* Understand when the Job Run started, ended, and how long it ran
Each Job Run has a **Details** page that provides comprehensive information about the workload execution.
The **Details** tab includes the following information about the Job Run execution:
The name of the Job Run, which is either user-defined or auto-generated.
Unique identifier for this specific Job Run.
Indicates if the Job Run is initializing (`Pending`), in progress (`Running`), finished (`Completed`), unable to be executed (`Failed`), manually stopped (`Cancelled`), or stopped because it exceeded its configured timeout (`Timed Out`).
Indicates when the Job Run was initiated.
Indicates when the Job Run terminated.
Indicates how much time elapsed between the Start Time and End Time.
The entity that triggered the Job Run (e.g., Airflow, user email).
The runtime size used for this Job Run (e.g., Tiny, Small, Medium, Large).
The version of the runtime environment used for this Job Run. When you specify a version alias such as `latest` or `preview`, the resolved concrete version is shown in parentheses (for example, `latest (1.5.1)`).
The maximum duration the Job Run is allowed to run before being automatically stopped, in seconds.
The AWS region where the Job Run executed. Different regions may have different performance characteristics and costs.
The URI of the Python file executed in this Job Run.
The Spark configuration details for this Job Run.
Allows you to stop an ongoing Job Run.
#### Consumption metrics
Each Job Run **Details** page specifies the consumption metrics and details associated with a specific workload execution, including the following:
The Table view includes the following elements:
The name or ID of the workload.
For **Notebook** and **SQL Session** workloads, click the workload name to copy its underlying workload ID to your clipboard. A tooltip displays the ID inline. This is useful when you need the ID for support or debugging, since these workload types do not have a separate detail page on Wherobots Cloud, like **Job Runs** do.
The entity that triggered the workload (Service Principal or User).
If your account is configured to the **User** role, and you use a [service principal](/get-started/wherobots-cloud/service-principals)-managed API key generated by an **Admin** in your Wherobots Organization, actions are attributed to the service principal in [**Audit Logs**](https://cloud.wherobots.com/organization/audit-logs), with the Admin shown as responsible solely for the API key creation.
The total duration of the workload.
The date and time when the workload completed, or "Running" status.
The AWS region where the workload executed.
The runtime size used (e.g., Tiny, Small, Medium, Large).
The estimated cost of the workload.
Spatial Units consumed by the workload so far. This information can be delayed by up to 20 minutes.
### Filter workloads
To locate specific workloads, you can use multiple filters:
1. Navigate to [**Workload History**](https://cloud.wherobots.com/workloads).
2. Use the **Filter by name or id** field to search for specific workloads.
3. Apply filters for **Time Range**, **Owner**, **Region**, or **Type** as needed.
## Manage Job Runs
In the [**Workload History**](https://cloud.wherobots.com/workloads) view, click on any Job Run workload row to view more information about that specific execution.
The detail page includes two tabs: **Details** and **Logs**.
### Details tab
The **Details** tab provides an overview of the Job Run’s configuration, runtime environment, and execution metadata so you can:
* Review Spark version, runtime size, and environment details
* Verify scheduling, trigger source, and timeout configuration
* Understand when the Job Run started, ended, and how long it ran
Each Job Run has a **Details** page that provides comprehensive information about the workload execution.
The **Details** tab includes the following information about the Job Run execution:
The name of the Job Run, which is either user-defined or auto-generated.
Unique identifier for this specific Job Run.
Indicates if the Job Run is initializing (`Pending`), in progress (`Running`), finished (`Completed`), unable to be executed (`Failed`), manually stopped (`Cancelled`), or stopped because it exceeded its configured timeout (`Timed Out`).
Indicates when the Job Run was initiated.
Indicates when the Job Run terminated.
Indicates how much time elapsed between the Start Time and End Time.
The entity that triggered the Job Run (e.g., Airflow, user email).
The runtime size used for this Job Run (e.g., Tiny, Small, Medium, Large).
The version of the runtime environment used for this Job Run. When you specify a version alias such as `latest` or `preview`, the resolved concrete version is shown in parentheses (for example, `latest (1.5.1)`).
The maximum duration the Job Run is allowed to run before being automatically stopped, in seconds.
The AWS region where the Job Run executed. Different regions may have different performance characteristics and costs.
The URI of the Python file executed in this Job Run.
The Spark configuration details for this Job Run.
Allows you to stop an ongoing Job Run.
#### Consumption metrics
Each Job Run **Details** page specifies the consumption metrics and details associated with a specific workload execution, including the following:
 The estimated cost of the workload execution.
Indicates the accumulated Spatial Unit Consumption for this workload.
Indicates the accumulated CPU usage for this workload.
Indicates the accumulated memory used for this workload.
#### Configuration information
Each Job Run **Details** page specifies the **Configuration** information associated with a specific workload execution, including the following:
Indicates the size of the Runtime associated with the workload.
Specifies the maximum duration the workload is allowed to run before being automatically stopped, in seconds. The default is `3600`.
Specifies the compute region where the workload is being executed.
The location or path of the Python script being executed.
### Logs tab
The **Logs** tab provides real-time access to execution logs for your Job Run including information about:
* File downloads and uploads
* Spark submit commands
* Spark version and environment details
* Warnings and error messages
* Application execution progress
The **Logs** tab includes the following information about the Job Run execution:
The name of the Job Run, which is either user-defined or auto-generated.
Unique identifier for this specific Job Run.
Indicates if the Job Run is initializing (`Pending`), in progress (`Running`), finished (`Completed`), unable to be executed (`Failed`), manually stopped (`Cancelled`), or stopped because it exceeded its configured timeout (`Timed Out`).
A link to the Spark UI for this Job Run. Available while the Job Run is in the `Running` state.
A folder icon button next to the **Spark UI** link opens the Spark event logs for this Job Run in the Storage Browser. Use these logs with tools like the Spark History Server to analyze a Job Run's performance after it has finished. Available when the Job Run produced event logs in your Wherobots-managed storage.
Search through log entries using
The estimated cost of the workload execution.
Indicates the accumulated Spatial Unit Consumption for this workload.
Indicates the accumulated CPU usage for this workload.
Indicates the accumulated memory used for this workload.
#### Configuration information
Each Job Run **Details** page specifies the **Configuration** information associated with a specific workload execution, including the following:
Indicates the size of the Runtime associated with the workload.
Specifies the maximum duration the workload is allowed to run before being automatically stopped, in seconds. The default is `3600`.
Specifies the compute region where the workload is being executed.
The location or path of the Python script being executed.
### Logs tab
The **Logs** tab provides real-time access to execution logs for your Job Run including information about:
* File downloads and uploads
* Spark submit commands
* Spark version and environment details
* Warnings and error messages
* Application execution progress
The **Logs** tab includes the following information about the Job Run execution:
The name of the Job Run, which is either user-defined or auto-generated.
Unique identifier for this specific Job Run.
Indicates if the Job Run is initializing (`Pending`), in progress (`Running`), finished (`Completed`), unable to be executed (`Failed`), manually stopped (`Cancelled`), or stopped because it exceeded its configured timeout (`Timed Out`).
A link to the Spark UI for this Job Run. Available while the Job Run is in the `Running` state.
A folder icon button next to the **Spark UI** link opens the Spark event logs for this Job Run in the Storage Browser. Use these logs with tools like the Spark History Server to analyze a Job Run's performance after it has finished. Available when the Job Run produced event logs in your Wherobots-managed storage.
Search through log entries using Cmd/Ctrl + F.
View timestamped log entries showing the execution progress.
Copy all log entries to clipboard.
Download the complete log file for offline analysis.
## Compare workload performance
To compare workload performance with different runtime types:
1. Run a workload. For more information on initializing a job and runtime selection, see [WherobotsRunOperator](/develop/run-operator).
2. Run that same workload again with either a larger or smaller runtime type.
3. Review the **Detail** pages for each executed Job Run to compare performance metrics, specifically:
* **Duration**
* **Max CPU Utilization**
* **Max Memory Utilization**
* **Cost(\$)**
* **SUs (Spatial Units)**
## Cancel a workload
Wherobots cancels workloads based on your specification of `timeoutseconds` in the Job Runs REST API Schema, which defaults to `3600`, but you can also cancel a workload in Wherobots Cloud.
To cancel a workload within Wherobots Cloud, do the following:
1. In [**Workload History**](https://cloud.wherobots.com/workloads), locate the Job Run you wish to cancel.
2. Click on the Job Run to open its detail page.
3. Click the **Cancel** button.
You can only cancel workloads that are in the `Pending` or `Running` state.
## Limitations
The following limitations apply to the Workload History feature:
Workload history data, including **Spatial Unit Consumption**, **Max CPU Utilization**, and **Max Memory Utilization** metrics, is only kept for 90 days.
**Spatial Unit Consumption** and **Cost** can take several minutes to display on a Job Run's **Detail** page.
The chart displays quota usage as a percentage of your organization's total computing power.