> ## Documentation Index
> Fetch the complete documentation index at: https://docs.wherobots.com/llms.txt
> Use this file to discover all available pages before exploring further.
# Visualize RasterFlow Outputs
> Use Wherobots-GL, Wherobots' native visualization tool, to view RasterFlow mosaics, predictions, and vectorized results.
Public Preview
**Wherobots-GL** is the visualization tool built into Wherobots. It loads spatial data **by URL** and appears in two places, backed by the same renderer:
* The [**Map**](https://cloud.wherobots.com/map) section in Wherobots Cloud.
* The inline `Map` widget in Wherobots notebooks, from the preinstalled `wherobots_gl` package.
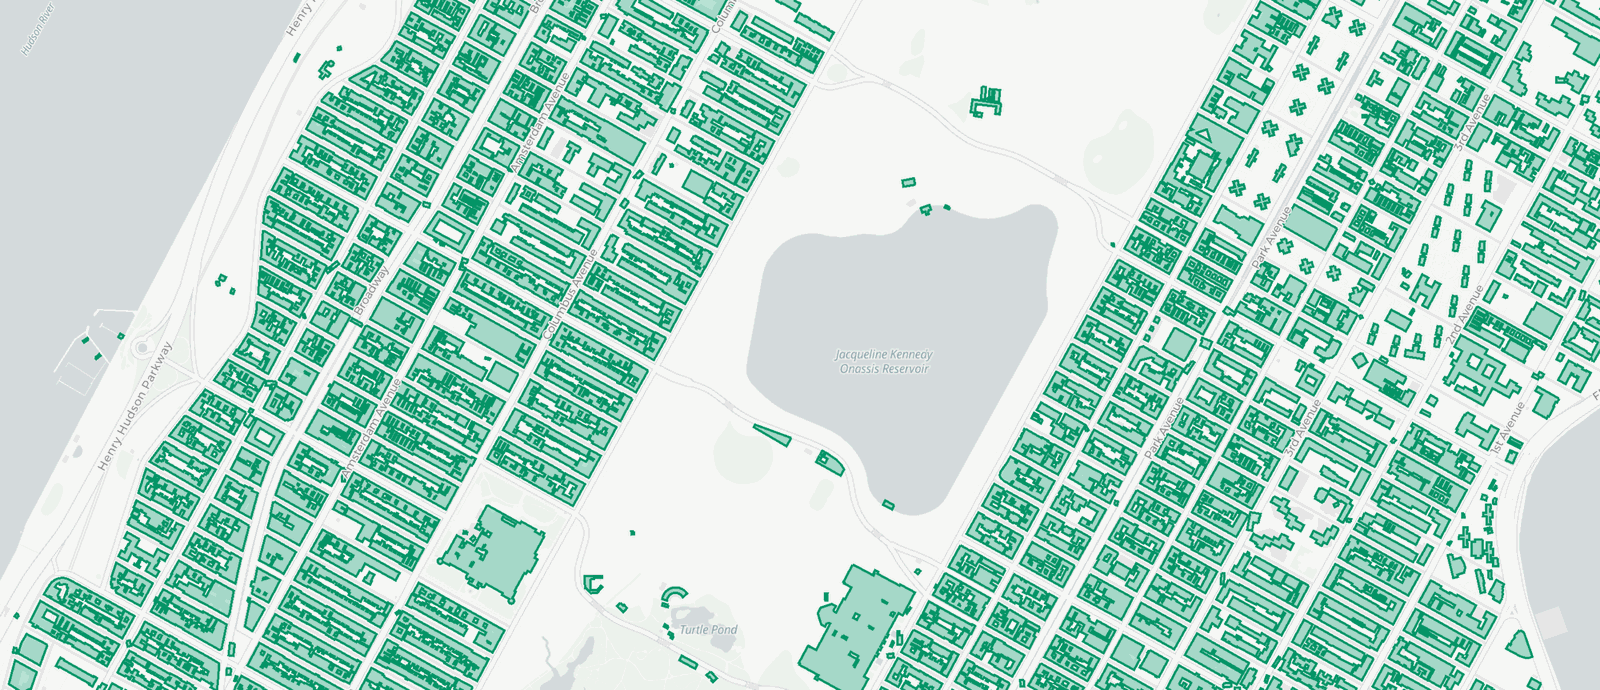
Both accept the formats RasterFlow produces, so you can view a mosaic, a model prediction, and the vectorized features derived from it on the same map:
| Format | Extension | Typical RasterFlow output |
| --------------------------------------------------------------------- | ------------------------- | ----------------------------------------------------------------------------------------------------- |
| [Zarr](/get-started/wherobots-fundamentals/glossary#zarr) | `.zarr` | Mosaics, model prediction stores, and [multiscale](/develop/rasterflow/rasterflow-multiscales) stores |
| [GeoParquet](/get-started/wherobots-fundamentals/glossary#geoparquet) | `.parquet`, `.geoparquet` | Vectorized results |
| Cloud Optimized GeoTIFF | `.tif`, `.tiff` | Source or exported imagery |
| PMTiles | `.pmtiles` | Pre-tiled vector layers |
## What you map, and when
A RasterFlow workflow produces three artifacts that you can visualize and inspect with Wherobots-GL:
| Layer | What it holds | When you open it |
| ---------------------- | -------------------------------------------------------------------------------------- | -------------------------------------------------------------------------------------- |
| **Mosaic** | Analysis-ready imagery for your area of interest, one value per pixel per band | **Before inference**, to confirm the mosaic is worth running a model over |
| **Prediction store** | Continuous per-pixel model scores, such as canopy height or field-boundary probability | **Before vectorizing**, to see how the scores are distributed and choose a `threshold` |
| **Vectorized results** | The polygons or points derived from those scores | **After vectorizing**, to check that features landed on real features in the imagery |
Visualization allows you to quickly see a mosaic is missing a tile, a cloud mask that dropped half a scene, a season that produced bare fields instead of crops, or a threshold that kept every marginal pixel.
Checking the mosaic first is also a cost control. Mosaicking and inference are billed as separate [RasterFlow Tasks](/get-started/organization-management/rasterflow-billing), so catching a bad mosaic before you run a model over it saves the RasterFlow Spatial Units of the inference run, and of everything downstream of it.
Stacking layers is what makes the check work: put the vectorized output over the mosaic it came from, and misaligned or spurious detections stand out immediately.
## Add a layer in Wherobots Cloud
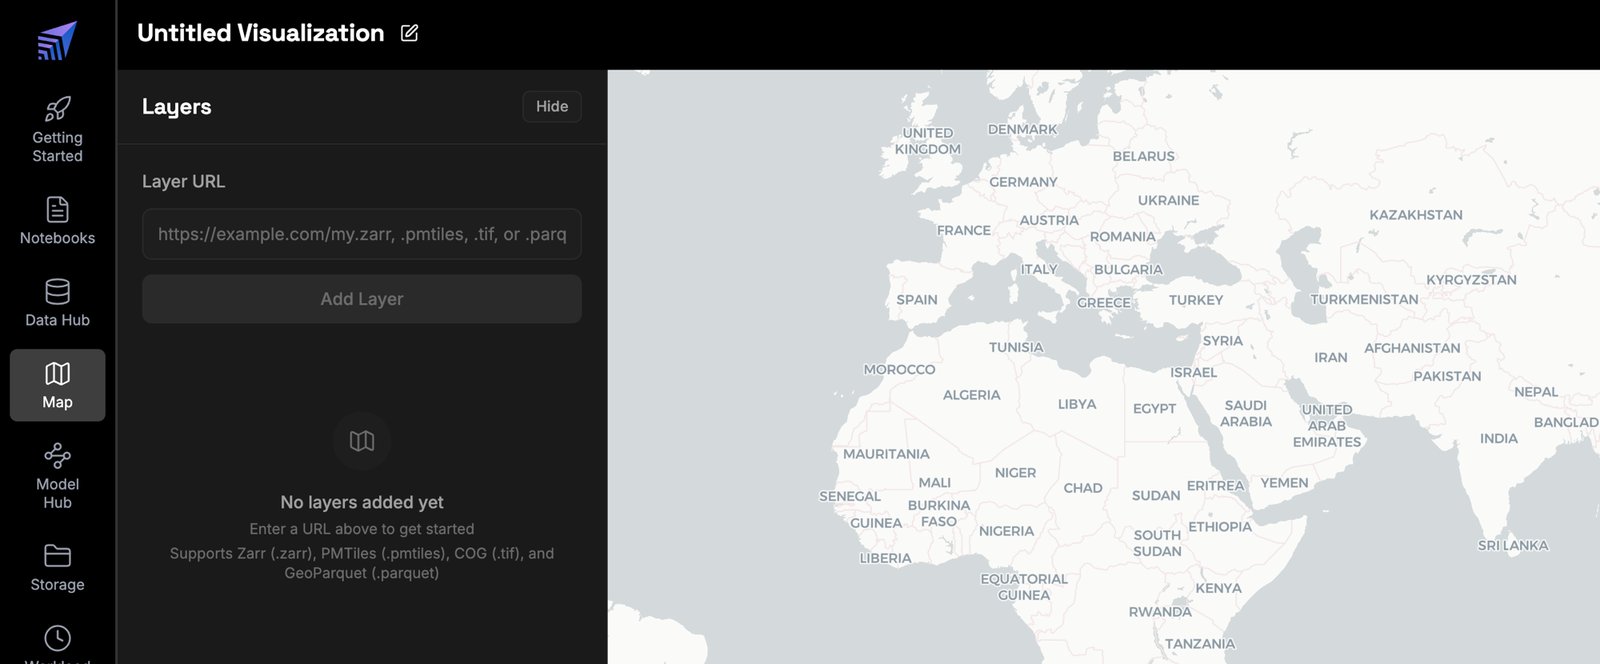
Go to [**Map**](https://cloud.wherobots.com/map) in the left sidebar of Wherobots Cloud, paste the URL of your output into **Layer URL**, and select **Add Layer**. Add more layers to stack them on the same map.
 ## Render a map in a notebook
Import `Map` and pass it one or more layers. A bare URL string works — the layer type is inferred from the extension — or pass a config dict to set the type and styling explicitly:
```python theme={"system"}
from wherobots_gl import Map
Map(
layers=[{
"type": "zarr",
"source": optimized_store.uri,
"name": "FTW predictions",
"colormap": "viridis",
}],
basemap="dark",
)
```
The widget is URL-based, so a DataFrame you derive in the notebook — filtered detections, for example — has to be written out before you can map it:
```python theme={"system"}
import os
vectors_path = os.getenv("USER_S3_PATH") + "predictions.parquet"
df_filtered.write.format("geoparquet").mode("overwrite").save(vectors_path)
Map(layers=[{"type": "geoparquet", "source": vectors_path, "name": "Filtered predictions"}])
```
## Render a map in a notebook
Import `Map` and pass it one or more layers. A bare URL string works — the layer type is inferred from the extension — or pass a config dict to set the type and styling explicitly:
```python theme={"system"}
from wherobots_gl import Map
Map(
layers=[{
"type": "zarr",
"source": optimized_store.uri,
"name": "FTW predictions",
"colormap": "viridis",
}],
basemap="dark",
)
```
The widget is URL-based, so a DataFrame you derive in the notebook — filtered detections, for example — has to be written out before you can map it:
```python theme={"system"}
import os
vectors_path = os.getenv("USER_S3_PATH") + "predictions.parquet"
df_filtered.write.format("geoparquet").mode("overwrite").save(vectors_path)
Map(layers=[{"type": "geoparquet", "source": vectors_path, "name": "Filtered predictions"}])
```
 ### Scope a query to see your visualization
The notebook widget writes its viewport back to the kernel as you pan and zoom. Use it to run a query over exactly the area on screen:
```python theme={"system"}
m = Map(layers=[{"type": "zarr", "source": optimized_store.uri}])
m # display, then pan and zoom to the area you care about
sedona.sql(f"SELECT * FROM detections WHERE {m.to_sql_filter('geometry')}")
```
`m.viewport_bbox` and `m.viewport_bbox_wkt` return the same extent in EPSG:4326, or, World Geodetic System (WGS) 84.
That query works under a few assumptions:
* **The table already exists in the session.** `to_sql_filter()` returns only a `WHERE` clause, so `detections` has to be queryable before you run the query. Register your vectorized output as a view first: `sedona.read.format("geoparquet").load(vectorized.uri).createOrReplaceTempView("detections")`.
* **The column you name holds geometries.** Pass the name of an actual geometry column — `to_sql_filter('geometry')` here — not a WKT string column.
* **That column is in EPSG:4326.** The filter is built from the map's WGS 84 bounds and nothing is reprojected for you, so wrap the column in `ST_Transform` first if it is stored in another CRS.
* **The map has rendered and reported its bounds.** The viewport travels from the browser back to the kernel, so display the map in one cell and run the query in a later one. `m.viewport_bbox`, `m.viewport_bbox_wkt`, and `to_sql_filter()` are all `None` until that round trip completes.
* **You are working in a notebook.** Viewport scoping needs a live kernel and a rendered widget, so it does not apply to a [Job Run](/develop/rasterflow/rasterflow-jobs).
## Where to get the layer URLs
You never construct these URLs yourself. They come from one of two places: the object a RasterFlow call returns, or the workload's entry in Workload History.
### From the RasterFlow call
Every RasterFlow call returns an object carrying the URI of what it just wrote, so getting a layer URL means reading one attribute off the value the call already returned, then printing it and pasting it into the map, or passing it straight to `Map`.
```python theme={"system"}
# Mosaicking -> MosaicResult
mosaic_index = rf_client.build_mosaics(...)
print(mosaic_index.first_row_mosaic) # URI of the mosaic store: the layer to visualize
print(mosaic_index.mosaic_index_uri) # the index itself, as GeoParquet
# Inference -> MosaicResult
model_output = rf_client.predict_mosaic_recipe(...)
print(model_output.first_row_mosaic) # URI of the prediction store
# Build Multiscales -> UriOutput
optimized_store = rf_client.build_zarr_multiscales(source_store=model_output.first_row_mosaic)
print(optimized_store.uri) # the optimized store: visualize this one, not the source
print(optimized_store.map_url) # opens that store directly in the Wherobots Cloud map viewer
# Vectorization -> VectorizeOutput
vectorized = rf_client.vectorize_mosaic(...)
print(vectorized.uri) # GeoParquet directory of vector features
```
A few cases to watch for:
* **More than one mosaic store.** `first_row_mosaic` is only the first store the index references. If your area of interest produced several, read `mosaic_index.mosaic_index_gdf` and take the URI of each store you want to view.
* **No features to vectorize.** `vectorize_mosaic()` still returns a `VectorizeOutput`, but its `uri` is `None` when the run produced no vector features, so there is nothing to map.
* **A DataFrame you derived yourself.** Nothing returns a URI for it. Write it to GeoParquet first, as shown above, and use the path you passed to `.save()`.
For the full definitions of `MosaicResult`, `UriOutput`, and `VectorizeOutput`, see the [Data Models reference](/reference/rasterflow/data-models).
### From Workload History
Every RasterFlow run is recorded in [**Workload History**](/develop/workload-history) in Wherobots Cloud, along with the outputs it wrote, so you can find a layer URL after the fact — for a [Job Run](/develop/rasterflow/rasterflow-jobs) you submitted, or a notebook session you have since shut down.
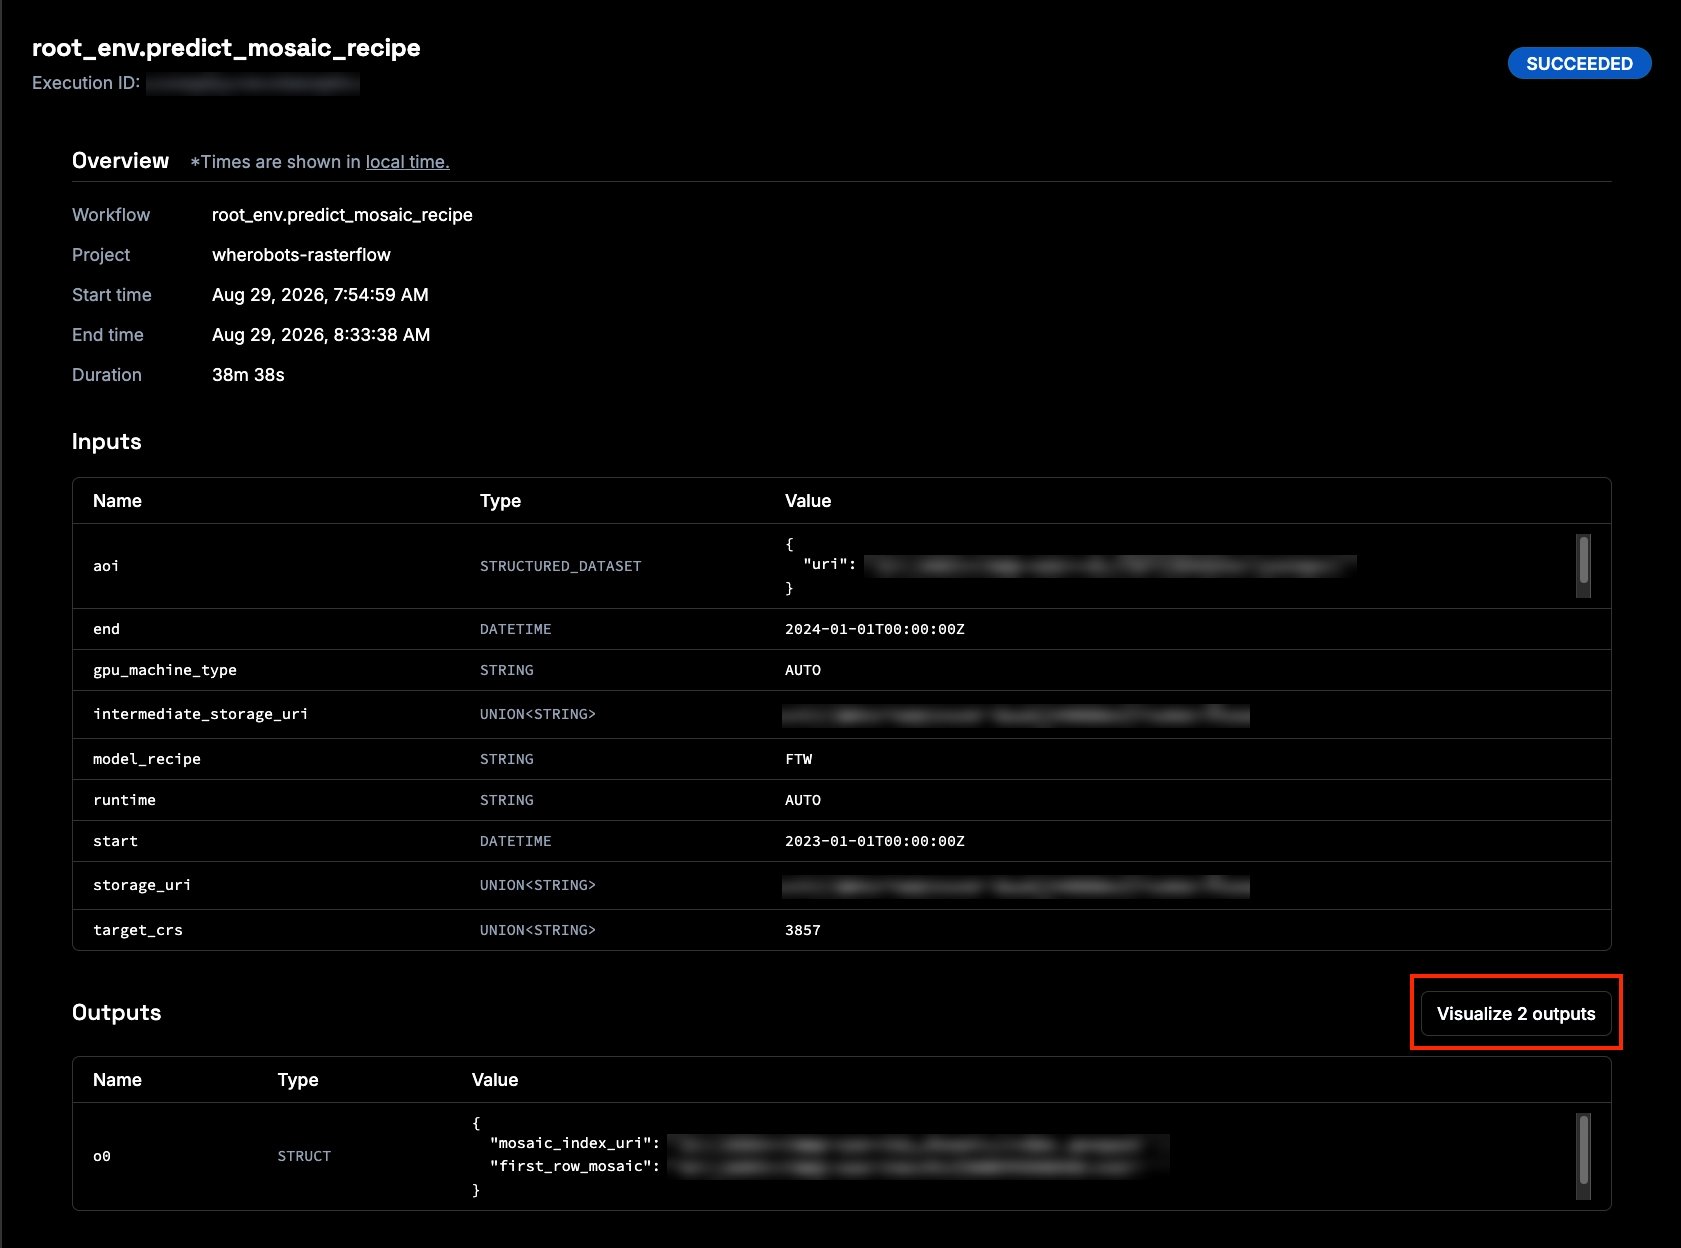
Go to [**Workload History**](https://cloud.wherobots.com/workloads) in the left sidebar of Wherobots Cloud and select the workload for your RasterFlow run. Its detail view lists what the run wrote under **Outputs**, and the **Visualize *n* outputs** button above that table opens them in the map viewer, so there is no URL to copy by hand.
### Scope a query to see your visualization
The notebook widget writes its viewport back to the kernel as you pan and zoom. Use it to run a query over exactly the area on screen:
```python theme={"system"}
m = Map(layers=[{"type": "zarr", "source": optimized_store.uri}])
m # display, then pan and zoom to the area you care about
sedona.sql(f"SELECT * FROM detections WHERE {m.to_sql_filter('geometry')}")
```
`m.viewport_bbox` and `m.viewport_bbox_wkt` return the same extent in EPSG:4326, or, World Geodetic System (WGS) 84.
That query works under a few assumptions:
* **The table already exists in the session.** `to_sql_filter()` returns only a `WHERE` clause, so `detections` has to be queryable before you run the query. Register your vectorized output as a view first: `sedona.read.format("geoparquet").load(vectorized.uri).createOrReplaceTempView("detections")`.
* **The column you name holds geometries.** Pass the name of an actual geometry column — `to_sql_filter('geometry')` here — not a WKT string column.
* **That column is in EPSG:4326.** The filter is built from the map's WGS 84 bounds and nothing is reprojected for you, so wrap the column in `ST_Transform` first if it is stored in another CRS.
* **The map has rendered and reported its bounds.** The viewport travels from the browser back to the kernel, so display the map in one cell and run the query in a later one. `m.viewport_bbox`, `m.viewport_bbox_wkt`, and `to_sql_filter()` are all `None` until that round trip completes.
* **You are working in a notebook.** Viewport scoping needs a live kernel and a rendered widget, so it does not apply to a [Job Run](/develop/rasterflow/rasterflow-jobs).
## Where to get the layer URLs
You never construct these URLs yourself. They come from one of two places: the object a RasterFlow call returns, or the workload's entry in Workload History.
### From the RasterFlow call
Every RasterFlow call returns an object carrying the URI of what it just wrote, so getting a layer URL means reading one attribute off the value the call already returned, then printing it and pasting it into the map, or passing it straight to `Map`.
```python theme={"system"}
# Mosaicking -> MosaicResult
mosaic_index = rf_client.build_mosaics(...)
print(mosaic_index.first_row_mosaic) # URI of the mosaic store: the layer to visualize
print(mosaic_index.mosaic_index_uri) # the index itself, as GeoParquet
# Inference -> MosaicResult
model_output = rf_client.predict_mosaic_recipe(...)
print(model_output.first_row_mosaic) # URI of the prediction store
# Build Multiscales -> UriOutput
optimized_store = rf_client.build_zarr_multiscales(source_store=model_output.first_row_mosaic)
print(optimized_store.uri) # the optimized store: visualize this one, not the source
print(optimized_store.map_url) # opens that store directly in the Wherobots Cloud map viewer
# Vectorization -> VectorizeOutput
vectorized = rf_client.vectorize_mosaic(...)
print(vectorized.uri) # GeoParquet directory of vector features
```
A few cases to watch for:
* **More than one mosaic store.** `first_row_mosaic` is only the first store the index references. If your area of interest produced several, read `mosaic_index.mosaic_index_gdf` and take the URI of each store you want to view.
* **No features to vectorize.** `vectorize_mosaic()` still returns a `VectorizeOutput`, but its `uri` is `None` when the run produced no vector features, so there is nothing to map.
* **A DataFrame you derived yourself.** Nothing returns a URI for it. Write it to GeoParquet first, as shown above, and use the path you passed to `.save()`.
For the full definitions of `MosaicResult`, `UriOutput`, and `VectorizeOutput`, see the [Data Models reference](/reference/rasterflow/data-models).
### From Workload History
Every RasterFlow run is recorded in [**Workload History**](/develop/workload-history) in Wherobots Cloud, along with the outputs it wrote, so you can find a layer URL after the fact — for a [Job Run](/develop/rasterflow/rasterflow-jobs) you submitted, or a notebook session you have since shut down.
Go to [**Workload History**](https://cloud.wherobots.com/workloads) in the left sidebar of Wherobots Cloud and select the workload for your RasterFlow run. Its detail view lists what the run wrote under **Outputs**, and the **Visualize *n* outputs** button above that table opens them in the map viewer, so there is no URL to copy by hand.
 [Build multiscales](/develop/rasterflow/rasterflow-multiscales) before viewing a mosaic or prediction store. RasterFlow writes stores at a single native resolution, so without overview levels the map streams full-resolution pixels at every zoom and feels unresponsive.
Public URLs need no further configuration.
For a private S3 source, set up a [Storage Integration](/develop/storage-management/s3-storage-integration) and write your RasterFlow output to that bucket, so access is granted once at the Organization level rather than per notebook. See [Use RasterFlow with a Storage Integration](/develop/rasterflow/rasterflow-storage-integration).
## Next steps
Add overview levels so a store pans and zooms smoothly.
A complete mosaic build that ends on the map.
[Build multiscales](/develop/rasterflow/rasterflow-multiscales) before viewing a mosaic or prediction store. RasterFlow writes stores at a single native resolution, so without overview levels the map streams full-resolution pixels at every zoom and feels unresponsive.
Public URLs need no further configuration.
For a private S3 source, set up a [Storage Integration](/develop/storage-management/s3-storage-integration) and write your RasterFlow output to that bucket, so access is granted once at the Organization level rather than per notebook. See [Use RasterFlow with a Storage Integration](/develop/rasterflow/rasterflow-storage-integration).
## Next steps
Add overview levels so a store pans and zooms smoothly.
A complete mosaic build that ends on the map.